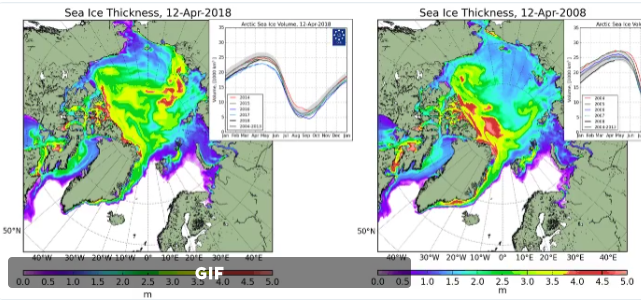
Using a comparison, Japanese skeptic blogger Kirye at KiryeNet drives home how “the real Arctic sea ice volume is much higher than in 2008.”
Source of images: DMI: http://ocean.dmi.dk
Using images and data from the Danish Meteorological Institute (DMI), Kirye put together and posted a comparator showing the immense March/early April sea ice volume increase the Arctic has seen since 2008. It totally defies the panicky claims of a “melting” Arctic, she tweeted.
You can see the animation comparator Kirye put together in action here at Twitter.

Arctic sea ice volume surges a whopping 3000 cubic kilometers since March 1st. Chart: DMI.
Kirye comments that although we have not once seen alarmists’ climate predictions come true, they continue to threaten us with sea ice doom.
Amid rapidly growing Arctic sea ice volume, they continue to cling to the claim it’s melting. That’s irrational.
Media hyperbole
Yesterday Anthony Watts posted here on the Arctic, remarking that the media claims of earlier this year of an unprecedented Arctic warmth had much more to do with hyperbole than with reality. Lately the Arctic has been a generous source of fake news from the global mainstream media giants, all claiming something that is not real, or making something that’s happened many times before look “unprecedented”.
Warm 12°C temperature spikes more than 70 times!
Back in January, 2016, I wrote here how “the Washington Post screamed bloody murder that the North Pole was in meltdown as temperatures at that singular location rose some “50 degrees above normal”, making it sound like this event had been an unprecedented phenomenon.
For that post I had gone back and examined DMI data Arctic temperatures above 80°N latitude going back some 58 years. Here’s what I found:
And examining all the years since 1958 we see that a temperature spike of some 12°K or more in a matter of a few days (during the November to March deep winter period) occurred more than 70 times! And over 100 times for spikes of 10°K and more.”
Once again, hat-tip: KiyreNet.


Great work as usual, Kiyre. 🙂
Thank you for your compliment. (^-^)
Well, compare summer ice extent/volume then 😉
2008:
http://ocean.dmi.dk/arctic/icethickness/anim/plots_uk/CICE_combine_thick_SM_EN_20080915.png
2017:
http://ocean.dmi.dk/arctic/icethickness/anim/plots_uk/CICE_combine_thick_SM_EN_20170915.png
That’s where the decrease in Artic sea ice is happening and what is meant by a possible ice free Arctic in the future (ice free means less than 1 km² of sea ice).
You can clearly see the development (extent, not volume) here:
http://woodfortrees.org/plot/nsidc-seaice-n/plot/nsidc-seaice-n/from:1980.6/every:12/plot/nsidc-seaice-n/from:1980.1/every:12
“…a possible ice free Arctic in the future” ???
lol …About that Arctic goalpost delivery? Just hold off on that awhile!
First it used to be ice-free by 2014, then certainly ice-free by 2050.
Now we are at: “possible Arctic ice-free in the future”!!
A linear fit gives us a summer sea ice decrease of 0.86 million km² per decade. The Arctic would be “ice free” in the summer by 2065 if the decrease continues.
But the decline STOPPED after 2007!
Give it up, since there were for a few thousand years in the early interglacial period of little to no Summer Ice in the Arctic region.
Here we are, with a lot of Polar Bears around, who didn’t decline with the Sea Ice declines from the 1990’s to 2006.
Indeed sunsettommy,
and if we are still coming out of the LIA cooling we should see some polar ice and glacier shrinkage. Expanding ice caps and glaciers could be seen as a warning of cooling, and we should be very wary of this.
Why not start in 2012? Sea ice extent increased from then on, right? Isn’t that great?
What does that have to do with the current development? Do you think because sea ice might have been less a while back without AGW it can’t be AGW this time? Is that the argument?
Yes, here we are, pretending nothing is wrong for reasons unknown.
Expanding?
Do you think that because the natural variation was far lower in the past than present that the low-but-not-as-low extent can’t be natural this time? When did natural variability stop influencing sea ice trends?
http://www.nature.com/nature/journal/v509/n7499/full/nature13260.html
“[A] substantial portion of recent warming in the northeastern Canada and Greenland sector of the Arctic arises from unforced natural variability.”
http://journals.ametsoc.org/doi/pdf/10.1175/JCLI-D-15-0741.1
“…a natural mode of Arctic winter variability resulting from the Nordic–Siberian seesaw of meridional winds […] is associated with two-thirds of the interannual variance [cooling-warming] of winter-mean Arctic temperature between 1979 and 2012, and possibly contributed a substantial fraction of the observed Arctic amplification [1998-2012 warming] in this period.”
“What does that have to do with the current development?”
It shows that the current level is still ANOMALOUSLY HIGH.
That points to the drop from 1979 to 2008 as being a RECOVERY toward more normal Holocene levels.
There is ABSOLUTELY ZERO evidence that the recent highly beneficial drop from the EXTREME level of the late 1970s was ANYTHING but part of a RECOVERY within a cyclic pattern.
Certainly there is ZERO evidence that humans had anything to do with it. TOTALLY NATURAL.
Why do you insist on thinking that an EXTREME extend in the late 1970s, similar to those of the LIA, is in any way “normal”
Why do you insist that the bleak, cold, debilitating times of the LIA, when humans struggled to exist and populations were devastated by famine and pestilence, is in any way desirable ???
Quite bizarre and irrational non-thinking, isn’t it seb.
“Yes, here we are, pretending nothing is wrong for reasons unknown.”
Here you are, fabricating issues that don’t exist, then making up FANTASY reasons for those non-problems.
The only real worry with Arctic sea ice is that the RECOVERY back towards lesser, more normal extents, seems to have stalled for the past 10 or so years.
Let’s all hope it doesn’t start to climb back up to extreme high levels again, shall we.
That would be a real nuisance even for massively huge ice-breaker class oil and gas supply ships.
Even the new Russian ice-melting nuclear ice-breakers could start to struggle.
Yes. We do know about the current mechanisms that are influencing climate. It’s no mystery blackbox “that could be all natural”. But of course it could all be because of the number 23 or something. Can’t really rule that out, can we?
It didn’t. Time to present the good old pattern test image again: https://imgur.com/a/IkdQh
Those oscillations are the natural variabilities. Along comes an ever-increasing GHE. Does that change the pattern in a recognizable way?
Do you think that because the natural variation was far lower in the past than present that the low-but-not-as-low extent can’t be natural this time?
So if the current Arctic sea ice trends can not be natural, but only anthropogenic, then what does that say about the Antarctic sea ice growth since 1979? Is a growing sea ice trend only anthropogenic too, or is that natural?
So you disagree with these scientists, then, that a substantial portion of the Arctic changes are natural?
Haine, 2016
“The midlatitude North Atlantic temperature changes since 2005 have greater magnitude and opposite sign (cooling) than those attributed to ocean uptake of anthropogenic heat The anthropogenic melt from the Greenland ice sheet is still too small to be detected. … And despite large changes in the freshwater budget of the Arctic, some of which are anthropogenic, there is no clear change in the delivery of Arctic freshwater to the North Atlantic due to human climate forcing.”
—
http://onlinelibrary.wiley.com/doi/10.1002/2016GL072212/full
“The surface warming trend has been principally attributed to sea ice retreat and associated heat fluxes from the ocean [Serreze et al., 2009; Screen and Simmonds, 2010a, b], to a negative trend in the North Atlantic Oscillation (NAO) since 1990, increasing warm air advection on the West Coast of Greenland and Eastern Canada [Hanna et al., 2012; Fettweis et al., 2013; Ding et al., 2014], and to an increase in the Greenland Blocking Index [Hanna et al., 2013]. These latter mechanisms could be dominated by natural variability rather than forced response to the anthropogenic increase in greenhouse gases [Fettweis et al., 2013; Screen et al., 2014].”
—
http://www.nature.com/nature/journal/v509/n7499/full/nature13260.html
“[A] substantial portion of recent warming in the northeastern Canada and Greenland sector of the Arctic arises from unforced natural variability.”
—
http://journals.ametsoc.org/doi/pdf/10.1175/JCLI-D-15-0741.1
“…a natural mode of Arctic winter variability resulting from the Nordic–Siberian seesaw of meridional winds […] is associated with two-thirds of the interannual variance [cooling-warming] of winter-mean Arctic temperature between 1979 and 2012, and possibly contributed a substantial fraction of the observed Arctic amplification [1998-2012 warming] in this period.”
—
http://www.dmi.dk/fileadmin/Rapporter/SR/sr05-02.pdf
Multi-decadal variation of the East Greenland Sea-Ice Extent: AD 1500-2000
“The ‘low frequency oscillation’ that dominated the ice export through the Fram Strait as well as the extension of the sea-ice in the Greenland Sea and Davis Strait in the twentieth century may therefore be regarded as part of a pattern that has existed through at least four centuries. … Apparently, a considerable fraction of the current withdrawal could be a natural occurrence.”
——————————————————————-
No, it doesn’t.
https://notrickszone.com/wp-content/uploads/2018/04/CO2-Emissions-and-Greenland.jpg
–
https://notrickszone.com/wp-content/uploads/2018/04/CO2-Emissions-and-Arctic-Air.jpg
–
https://notrickszone.com/wp-content/uploads/2018/04/CO2-Emissions-and-Greenland-Ice-Sheet.jpg
“Along comes an ever-increasing GHE”
Where ?????
There is ZERO empirical evidence of it, anywhere, anytime, anyplace…..
It must be some sort of imaginative boogie man, fantasy, fairy-tale thing, hey seb.
Do you still use a night-light, seb, in case of the monsters in the closet?
“We do know about the current mechanisms that are influencing climate.”
Mostly, maybe,
There is a lot we don’t know about the influence of the Sun and its many variables…
There is a lot we are not sure of when it comes to volcanic heating of oceans.. keep finding more and more…
…but there is one thing we can be pretty CERTAIN about..
and that is that enhanced atmospheric CO2 IS NOT ONE OF THEM. !!
Never has before, no reason or evidence (except fantasy agendas) to even suggest its possible.
Storms in 2007 broke “ice arches,” and much ice was flushed out via the Nares Strait. The Arctic lost a massive amount of thick, multiyear sea ice, that melted at lower latitudes — in warmer water.
Full story on WUWT and elsewhere.
Here is one
The Antarctic sea ice (extent) growth is expected in a warming world. Antartica is still losing ice mass though. Or are you going to continue to stick to your “Antartica net reduction of sea level due to SMB increase” story?
Exactly.
It would appear that you’re just making stuff up again.
Comiso et al., 2016
http://journals.ametsoc.org/doi/abs/10.1175/JCLI-D-16-0408.1
“The Antarctic sea ice extent has been slowly increasing contrary to expected trends due to global warming and results from coupled climate models.”
—
Hobbs et al., 2016
http://onlinelibrary.wiley.com/doi/10.1002/2016JC012111/abstract
“Observations show that Southern Ocean sea ice extent has increased since 1979, whereas global coupled climate models simulate a decrease over the same period.”
—
Meehl et al., 2016
http://www.nature.com/ngeo/journal/vaop/ncurrent/full/ngeo2751.html
“Antarctic sea-ice extent has been slowly increasing in the satellite record that began in 1979. Since the late 1990s, the increase has accelerated, but the average of all climate models shows a decline.”
Again, since you believe the decline in Arctic sea ice in recent decades is only anthropogenic, and not natural, is the growth in Antarctic sea ice since the 1970s only anthropogenic and not natural too? You are wrong if you believe the growth in SH sea ice has been expected with warming (well, since it’s cooled). Climate models all simulate a decline in Antarctic sea ice. So will you be answering this question?
“Antartica is still losing ice mass though.”</em
Even if it is, which is highly debateable, it is obviously NOTHING to do with anything humans are doing, and its ABSOLUTELY TINY.
https://s19.postimg.cc/fqrsmq8oj/Antarctic_ice_mass2.png
Can't be CO2, It doesn't cause any warming of any sort. You have PROVEN that with your total lack of empirical evidence.
Can't be from atmospheric warming either, because its NOT.
https://s19.postimg.cc/yubej7oyr/ant-ta-monthly-1979-2016-11-01.gif
There was an El Nino surge that took away a lot of sea ice last couple of years. Again, NOTHING to do with human CO2 or any other sort of CO2.
Also some melting from volcanic activity from below.. are you going to try to blame that on human CO as well?
Linear fit – please never post anything ever again. You can’t apply a linear fit to a process that is so obviously not linear.
Please remember this the next time Pierre or Kenneth post something about a paper trying to predict the future by curve fitting 😉
Can you describe the process of the sea ice extent decrease? It certainly isn’t linear, that was just a cheap way to illustrate where the trend is going … but what is it? Using a polynomial fit, the time until we have an “ice free” Arctic only decreases. Of course we could imagine that the ice extent will actually stabilize or even increase despite the globe warming. But what would be the mechanism for this?
Only a mathematically inept clown would think Arctic sea ice should fit a polynomial function.
Oh, its you, seb !.
DENY cycles like the AMO, which have driven cycles of sea ice since the year dot.
And what is this “gullible warming” nonsense you are on about.
There’s been no warming in the satellite record apart from SUN powered El Nino.
You aren’t still going on about CO2 warming anything nonsense are you, ??
Despite a total lack of any evidence.
That would be just mindless trolling.
Hey moderator, I thought you would be “snipping” away obvious troll comments with insults all over them like the one from AndyG55 here? Calling everything nonsense, I thought that’s not allowed anymore? Hmm …
Where did I call you anything, seb?
You seem to have comprehension and whinging issues, seb.
Explain why you think a polynomial fit has any relevance at all to climate anything.
While you are at it… where is your EVIDENCE of CO2 warming, seb.
We are all waiting….. indefinitely, it seems.
“A linear fit gives us a summer sea ice decrease of 0.86 million km² per decade. The Arctic would be “ice free” in the summer by 2065 if the decrease continues.”
The mathematical ineptitude and base-level ignorance of anything resembling mathematical common-sense displayed in that one sentence, DEFIES BELIEF !!!
https://www.youtube.com/watch?v=zrWoG8IckyE
A linear fit is a straight jacket and you should be fitted with one straight away.
And what is this? Another comment posted, just for the insult?
tears !!!
Poor seb has never been able to escape from the mental straitjacket of the AGW mantra.
It fits him so perfectly, and it is like a security blanket to him.
““…a possible ice free Arctic in the future” ???”
You mean like for most of the first 3/4 or so of the Holocene.?????
Well done seb, you have just ADMITTED that we are very much in a COOL period of the interglacial.
…. another accidental step forward !!! 🙂
Awaiting the mandatory faceplant , 🙂
“…ice free Arctic in the future”
Wasn’t that James Hansen’s call?
When you can come up with a graph that starts in, oh .. let’s say 1910 then you might be worth listening to — but probably not.
There is ample evidence, though not from satellites, that ice cover in the 1930s was also considerably less than in the 1970s. Indeed it seems that, fortuitously for them, the climastrologists point at which “records began” coincided with a 20th century peak in Arctic ice cover. Had they had access to satellite technology 40 years earlier you would be singing a different — but doubtless equally inaccurate — tune.
If only there were reconstructions of summer ice extents, right?
http://projects.iq.harvard.edu/files/climate/files/kinnardetal2011.pdf
See the graph in figure 3? Summer extent was between 9 and 11 million km² for the last 1000+ years … the graph ends with a value of around 8 million km² and last year it was below 5 million km².
What tune would you like to sing? Something about “the data is fake” maybe to wiggle yourself out of this dead end?
ROFLMAO
All but 4 are selected land based temperature records .. for reconstruction sea ice though a nonsense driven model
The temperatures on Greenland certainly DO NOT follow this pattern, neither to temperatures anywhere else.
This passes for science in seb’s world. WOW. !!!
Odd that it bares ZERO resemblance to any historic, biological, or other record.
Paper has been ripped apart on several forums as being a monumental joke.
Annual MEAN in the mid 1950s was 6 million km²
https://s19.postimg.cc/bwl42st4j/Arctic_ice_DOE.gif
The Kinnard graph is just nonsense.
Kinnard’s reconstruction used circumpolar TERRESTRIAL paleoproxies for temperature (yup, Yamal tree rings, upsidedown northern Scandanavian lake varves) and then a modeled guestimate for ensuing sea ice.
We know that is bogus because it ignores the impact ocean currents have on underside melting.
Nor does it even match know temperature proxies.
The Kinnard abstracts only takeaway was “extreme uncertainty remains”. ie.. they haven’t got a clue.
Even more gigo is to append the satellite era ice observations to the bogus ‘guesstimate’— Mann’s Nature trick regurgitated.
Some basic reading , seb.
Try to keep up….
https://climateaudit.org/2011/12/05/kinnard-arctic-o18-series/
The main proxies used don have that spurious fabricated hockey stick at the end.
https://climateaudit.files.wordpress.com/2011/12/compare_o18.png
“Something about “the data is fake””
No, just the graph and the methodology.
Seems you already knew that, didn’t you seb !! 🙂
Actually, that O18 data looks quite realistic.
https://climateaudit.files.wordpress.com/2011/12/compare_o18.png
2 Degrees warmer than now 2000 years ago.
Cooling down into the LIA cold anomaly,
Then a slight bump up starting around 1800, to a small peak in 1998
Even the 1940s shows up in the grey lines
(Just ignore the weird red AGW Agenda driven reconstruction)
SD units aren’t degrees …
You are right though, The differences need to be divided by about 0.6.
Since these are anomalies, that makes each δO18 unit equal to about 1.7C difference.
Thanks for the correction, seb 🙂
Now take another faceplant !!
Massive gain from the El Nino affected 2017 summer extent.. Wouldn’t you agree seb??
Russian charts ALSO show the BIG gain in old ice. !!
https://s19.postimg.cc/7u9de975v/Russian_ice.jpg
Anyway, as you are by now WELL AWARE, Arctic sea ice extent is still well inside the TOP 10% of extents of the last 10,000 years.
Surly you don’t DENY that fact. !!!
https://s19.postimg.cc/vgdnb299v/Arctic-_Sea-_Ice-_Holocene-_Stein-17.jpg
Only time its been higher being the EXTREMES of the LIA period, Late 1970s extent was up there with the LIA, or were you UNAWARE of that , as well.
—-
Here’s a RELEVANT little analogy for you…
If you have a block of ice in the freezer (LIA) and put it in the refrigerator section (current)..
…. what happens to it ?
—
And thanks for the pics showing the increase in thicker sea ice since 2008, even after the massive El Nino and battering. Quite amazing how well the sea ice held up, wouldn’t you agree, seb. !!
And starting in 1980, at the very peak of sea ice extents, up with the EXTREMES of the LIA…. seriously.!!!!
Do try to learn that that sort of mindless propaganda doesn’t work here. !!
Try a more REALISTIC approach , that actually matches temperature quite well. (you do agree that temperatures drive sea ice somewhat, don’t you)
https://s19.postimg.cc/hcmhnqak3/Arctic-_Sea-_Ice-_Alekseev-2016-as-shown-in-_Connolly-2017.jpg
You do agree that the late 1970s was the coldest period in the Arctic since the last WARM period around 1940, don’t you
Or are you deep in de-nile, and unable to swim. !!!
“(ice free means less than 1 km² of sea ice).”
You mean 1 Wadham of sea ice.. correct 😉
seb,
Just goes to show how dynamic the coverage can be. Vast lumps of ice floating in the potentially warmer waters, and subjected to the vagaries of the weather. Is it any wonder that it varies.
Tony Heller exposes the “Arctic is melting” nonsense, using historical scientific data that the climatastrophists ignore.
https://www.youtube.com/watch?v=nIEGo8E9s_8
‘Linear fit’ – please never post anything ever again. You can’t apply a linear fit to a process that is so obviously not linear.
A polynominal fit would mean an even earlier ice free time.
A polynomial????
WT* makes you think it should be fitted to a polynomial ?
Irrational anti-mathematical twaddle.
DUMB !!!
He doesn’t “get it.” He never has, and probably never will.
“Warm 12°C temperature spikes more than 70 times!
Back in January, 2016, I wrote here how “the Washington Post screamed bloody murder that the North Pole was in meltdown as temperatures at that singular location rose some “50 degrees above normal”, making it sound like this event had been an unprecedented phenomenon.”
It is indeed and interesting phenomena and as any weather person knows, it happens quite often in NH winters. It seems happens more often when the sunspot count is declining (after the solar peak) and it appears to affect the North polar region more when the sun is at a minimum (like now, last year, and 2016).
Usually these episodes are cause by a Sudden Stratospheric Warming (SSW) event. SSW happen when the some warming happens very high up (at a pressure level hight of 10-30 hPa) in the atmosphere above the pole. Here is a record of this year’s warming back in February –http://ds.data.jma.go.jp/gmd/tcc/tcc/products/clisys/STRAT/index.html. Up in this rarefied atmosphere the warming causes some atmospheric expansion. Usually if this warming has any effect on the lower levels of the atmosphere (it doesn’t always, and no one knows why) it will take from 1 week to a month to work it’s way down (why so long? No one know for sure.)
The method of affecting the lower atmosphere is basically that the SSW causes an expansion in the upper atmosphere, this exerts a pressure on the lower layers of the atmosphere above some part of the polar region, where it resolves into a warm high pressure region in the troposphere. This high pressure will displace some, or all, of the normal polar vortex sending it to the outer polar regions, or the temperate regions.
So to recap — SSW expands air in the high stratosphere, stratosphere then exerts downward pressure on atmospheric layers below it, resulting in high pressure weather pattern in the troposphere over the polar region (or part of it), whilst the increase in air pressure warms the air. This high pressure on, or near, the pole displaces the polar vortex and jet-stream out towards the temperate geographical areas. And so the polar cold air mass and all it’s attendant volatility hit places like Europe, or North America, or Siberia/Russia/Eurasia or maybe (sometimes) all of them. And it gives us the characteristic wobbly jet-stream — this persists for some month after the initiating SSW event.
The strange correlation that has occurred many time recently with these particular dynamic SSW events is that they have occurred either just after or during a period when there has been an Earth facing solar coronal hole. So far this aspect has not been scientifically proven to be so — yet. We do know that solar coronal holes are known to send out charged particles that can warm up the very high atmosphere, as well as causing nature’s light show of the Northern auroras.
Sorry everyone messed up the formatting (again) — the quote at toptop should only be in italics.
@tomOmason
I sometimes find this link helpful to check my formatting prior to publishing.
https://htmledit.squarefree.com/
That wobbly jet-stream is still playing havoc in the USA…
here’s a few weather effects they are suffering http://www.wpc.ncep.noaa.gov/discussions/nfdscc3.html
— it’s all natural, just what is normal with a sun with lower activity….
As I’ve said before, it is quite normal for ice to melt while we are coming out of the LIA, ice build-up over a long term is a big warning that we are no long leaving a warming period but starting a cooling period.
Basically sudden warming of the Arctic has nothing to do with CO2 levels or the mythical ‘Global Warming’.
[…] Arctic Freezamageddon…Sea Ice Volume Surges 3 TRILLION Cubic Meters Since Early March! […]
I would love to see an ice free Arctic. That would a proof of a warn and nice climate. Climate improvement. Perhaps Sahara could be a forest again as in the «near» past. But this is just the wet dream of the alarmists. Now colder times are approaching for tens of years.
KnutA
And Spain’s interior desert would be replenished as the wild life filled forest and grassy plains that the Romans knew, complete with the lions, hippos, giraffes, etc., that they use to hunt there.
Warm climate was so good for all life back then.
[…] Ref.: https://notrickszone.com/2018/04/17/arctic-freezageddon-sea-ice-volume-surges-3-trillion-cubic-meters… […]
The icecaps are melting! The icecaps are melting!
On Mars?
HAHAHAHAHAHAHA!
Mars and Earth orbits are not in sync, Yonason. It’s an orbital or rather axis tilt thing.
https://www.space.com/33001-mars-ice-age-ending-now.html
https://phys.org/news/2012-09-mars-climate-variations-driven-sun.html
Be very skeptical of what Soon says and/or publishes.
Soon is far more likely to be correct than basically ANY of the AGW stall-warts that you worship.
“Be very skeptical of what Soon says and/or publishes” – SebH
He gives me advice I didn’t ask for, don’t need or want, and which is totally wrong. Talk about being in a totally different orbit and/or tilt.
[…] Read more at No Tricks Zone […]
[…] example in last Tuesday’s post Kirye delivered the key parts on the Arctic Freezamageddon. Our aim is to provide more of such posts in the […]
[…] example in last Tuesday’s post Kirye delivered the key parts on the Arctic Freezamageddon. Our aim is to provide more of such posts in the […]
[…] esempio, nel post di martedì scorso Kirye ha consegnato le parti chiave dell’Arctic Freezamageddon. Il nostro obiettivo è di fornirvi un maggior numero di questi post in […]
[…] is happening, but it is happening fast. Take one look at artic sea ice and headlines like “Freezamageddon…Sea Ice Volume Surges 3 TRILLION Cubic Meters Since Early March!” and one can start to get an idea of what is already happening on the ground. “If the […]