The Effect Of CO2 Increases On Ocean Temperatures Is Too Small To Measurably Detect

The Effect Of CO2 Increases On Ocean Temperatures Is Too Small To Measurably Detect

The shallowest sea surface temperature measurement limit is 10,000 times deeper than the extent of CO2’s radiative influence.

When sea surface temperatures (SSTs) are measured, the depth range of the measurement typically extends from 10 cm to 10 m, or 100 mm to 10,000 mm (Merchant et al., 2019).

Image Source: Merchant et al., 2019

This measurement limitation is an insurmountable problem for those who wish to link increases in SSTs to increases in anthropogenic CO2 emissions.

Why? Because CO2’s radiative influence can only extend to ocean depths of 0.01 mm, or 1/100ths of a millimeter (Wong and Minnett, 2018).

CO2’s total impact on ocean temperatures cannot therefore be detected, as the shallowest SST measurements are 100 mm – 10,000 times deeper than the range limit for CO2’s radiative impact.

Image Source: Wong and Minnett, 2018

The physical impossibility of obtaining a detectable (and thus measurable) CO2 signal is not the only problem in attributing SST warming to anthropogenic CO2 emissions.

At a single site, SSTs can vary by as much as ±1-3°C, depending on depth. The water temperature at 1,000 mm (1 meter) may be 2°C warmer than at 10,000 mm (10 meters), depending on factors such as the time of day the measurement was taken, or if it was a cloudy versus sunny day (Kennedy, 2014). Pulling a wooden bucket out of the water from a ship deck – which is how SSTs were routinely measured until the late 20th century – can yield multiple degrees differences if the water in the bucket was hauled onto the ship at 7 a.m. rather than 3 p.m.

Image Source: Kennedy, 2014

To accurately assess the SST for the locations where sailors pulled buckets out of the water, then, would require “regular measurements of near-surface waters at a range of depths” (Kennedy, 2014). These data are surely not available in the historical SST records.

Consequently, the “random and systematic error uncertainty” in every single buckets-derived SST measurement is about 1 to 1.5°C. With water covering 71% of the Earth’s surface, this error and uncertainty magnitude fully disqualifies any claim that instrumental data accurately reflect the global average surface temperature.

Image Source: Kennedy, 2014

Green Energies Shattering German Economy…Industrial Production Falls 7th Consecutive Month

-1.6%!

That’s how much Germany’s industrial production fell in December, 2023. It’s the seventh-straight month of decline as the country’s energy woes mount.

One reason is reported by the Wall Street Journal (WSJ) reports today :”Germany’s Industrial Production Falls For Seventh-Straight Month” in December 2023, far worse than expected.

To underscore the seriousness, 2023’s industrial production result is a whopping 10% below pre-pandemic levels.

One of the major drivers behind the demise is arguably the country’s disastrous energy policy, which has entailed shutting down cheap and steady conventional sources such as nuclear and natural gas and increasingly relying on unstable wind and solar energy. Energy prices have soared over the past years, thus driving inflation.

Things aren’t expected to improve much any time soon as the country is currently being plagued by strikes by train drivers, airport and airline personnel, who are fighting for higher wages that have been eroded away by high inflation. Energy supplies remain unstable and are expected to stay high.

Farmers are angry and have been demonstrating for weeks, often blocking transportation routes.

If there’s any light at the end of the tunnel, it’s a very faint one and the tunnel may be very long.

Currently many companies are announcing plans to move operations to business- friendlier locations.


2023 Scientific Papers Cast Doubt On ‘Consensus’ In Climate Science

In 2023, hundreds of scientific papers were published that cast doubt on the position that anthropogenic CO2 emissions function as the climate’s fundamental control knob…or that otherwise serve to question the efficacy of climate models or the related “consensus” positions commonly endorsed by policymakers and mainstream media sources.

There are significant limitations and uncertainties inherent in our understanding of climate and climate changes.

For the last 9 years we have been compiling annual lists of scientific papers that support these four main skeptical positions — categorized here as N(1) – N(4) — which question the climate alarm popularized in today’s headlines.

N(1) Natural mechanisms play well more than a negligible role (as claimed by the IPCC) in the net changes in the climate system, which includes temperature variations, precipitation patterns, weather events, etc., and the influence of increased CO2 concentrations on climatic changes are less pronounced than currently imagined.

N(2) The warming/sea levels/glacier and sea ice retreat/precipitation extremes…experienced during the modern era are neither unprecedented or remarkable, nor do they fall outside the range of natural variability.

N(3) The computer climate models are neither reliable or consistently accurate, the uncertainty and error ranges are irreducible, and projections of future climate states (i.e., an intensification of the hydrological cycle) are not supported by observations and/or are little more than speculation.

N(4) Current emissions-mitigation policies, especially related to the advocacy for renewables, are often ineffective and even harmful to the environment, whereas elevated CO2 and a warmer climate provide unheralded benefits to the biosphere (i.e., a greener planet and enhanced crop yields, lower mortality with warming).

In sharp contrast to the above, the corresponding “consensus” positions that these papers do not support are:

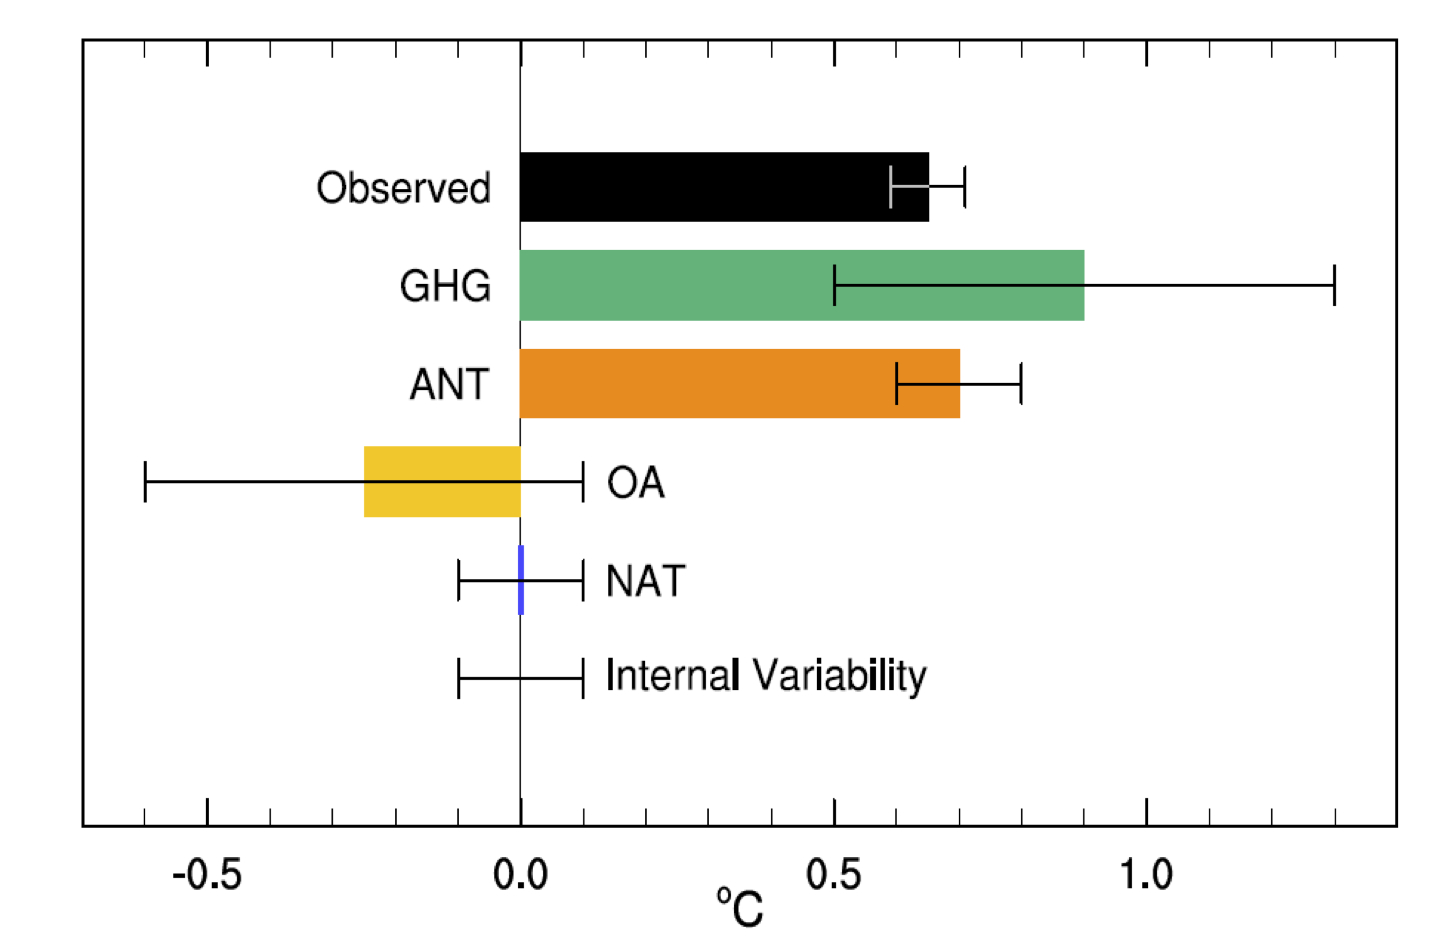
A(1) Close to or over 100% (110%) of the warming since 1950 has been caused by increases in anthropogenic CO2 emissions, leaving natural attribution at something close to 0%.

RealClimate.org: “The best estimate of the warming due to anthropogenic forcings (ANT) is the orange bar (noting the 1𝛔 uncertainties). Reading off the graph, it is 0.7±0.2ºC (5-95%) with the observed warming 0.65±0.06 (5-95%). The attribution then follows as having a mean of ~110%, with a 5-95% range of 80–130%. This easily justifies the IPCC claims of having a mean near 100%, and a very low likelihood of the attribution being less than 50% (p < 0.0001!).”

A(2) Modern warming, glacier and sea ice recession, sea level rise, drought and hurricane intensities…are all occurring at unprecedentedly high and rapid rates, and the effects are globally synchronous (not just regional)…and thus dangerous consequences to the global biosphere and human civilizations loom in the near future as a consequence of anthropogenic influences.

A(3) The climate models are reliable and accurate, and the scientific understanding of the effects of both natural forcing factors (solar activity, clouds, water vapor, etc.) and CO2 concentration changes on climate is “settled enough”, which means that “the time for debate has ended”.

A(4) The proposed solutions to mitigate the dangerous consequences described in N(4) – namely, wind and solar expansion – are safe, effective, and environmentally-friendly.

To reiterate, these 2023 papers support the N(1)-N(4) positions, and they undermine or at least do not support the “consensus” A(1)-A(4) positions.  These papers do not do more than that.   In other words, it is too ambitious to claim these papers prove that anthropogenic global warming (AGW) positions are invalid, or that AGW claims have now been debunked”.

Below is the link to the list of scientific papers published in 2023, as well as a few sample papers.

Skeptic Papers 2023

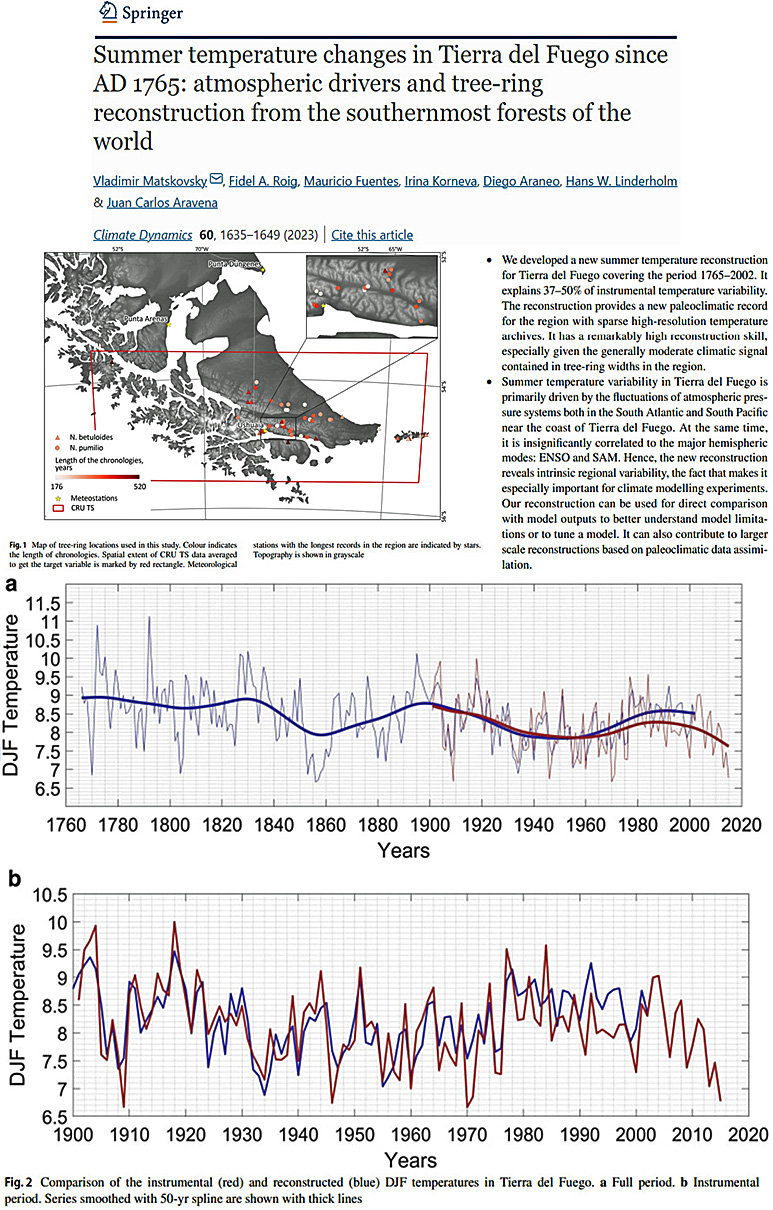
Matskovsky et al., 2023
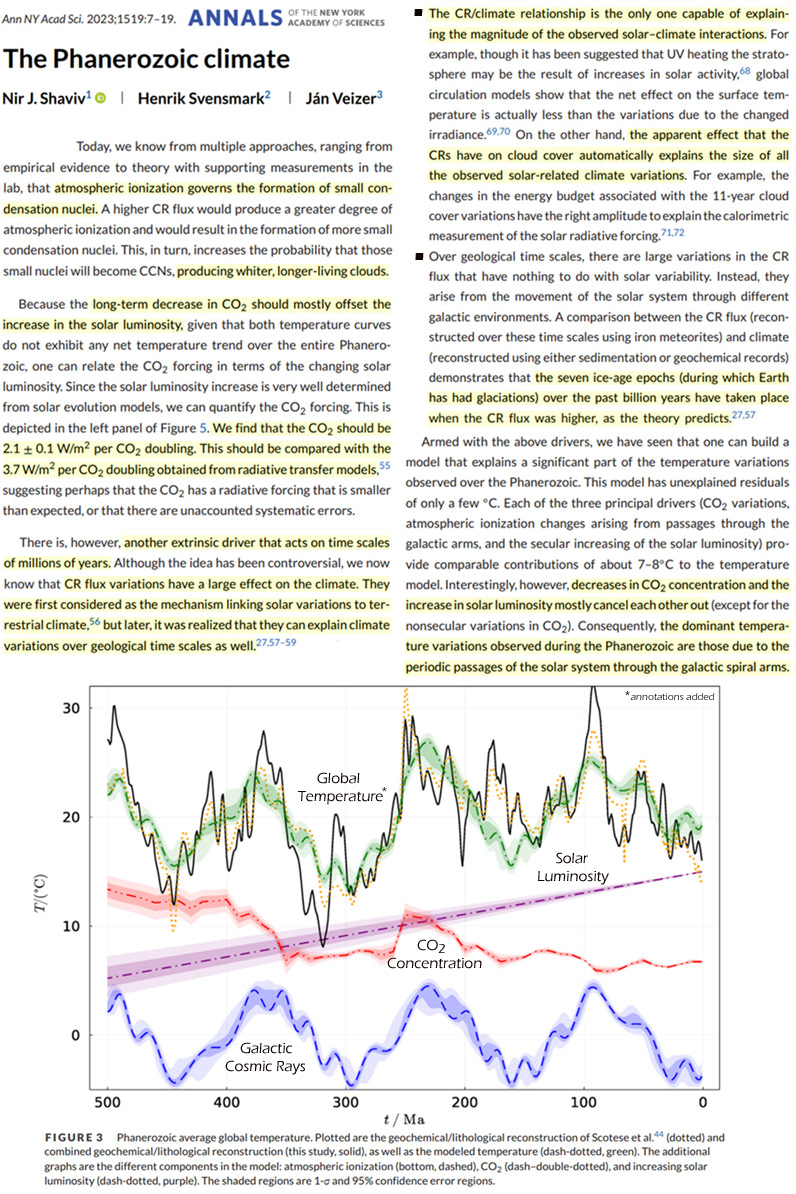
Shaviv et al., 2023

The CR/climate relationship is the only one capable of explaining the magnitude of the observed solar-climate interactions. … The apparent effect that the CRs have on cloud cover automatically explains the size of all the observed solar-related climate variations. … The seven ice-age epochs…over the past billion years have taken place when the CR flux was higher, as the theory predicts. … Decreases in CO2 concentration and the increase in solar luminosity mostly cancel each other out.

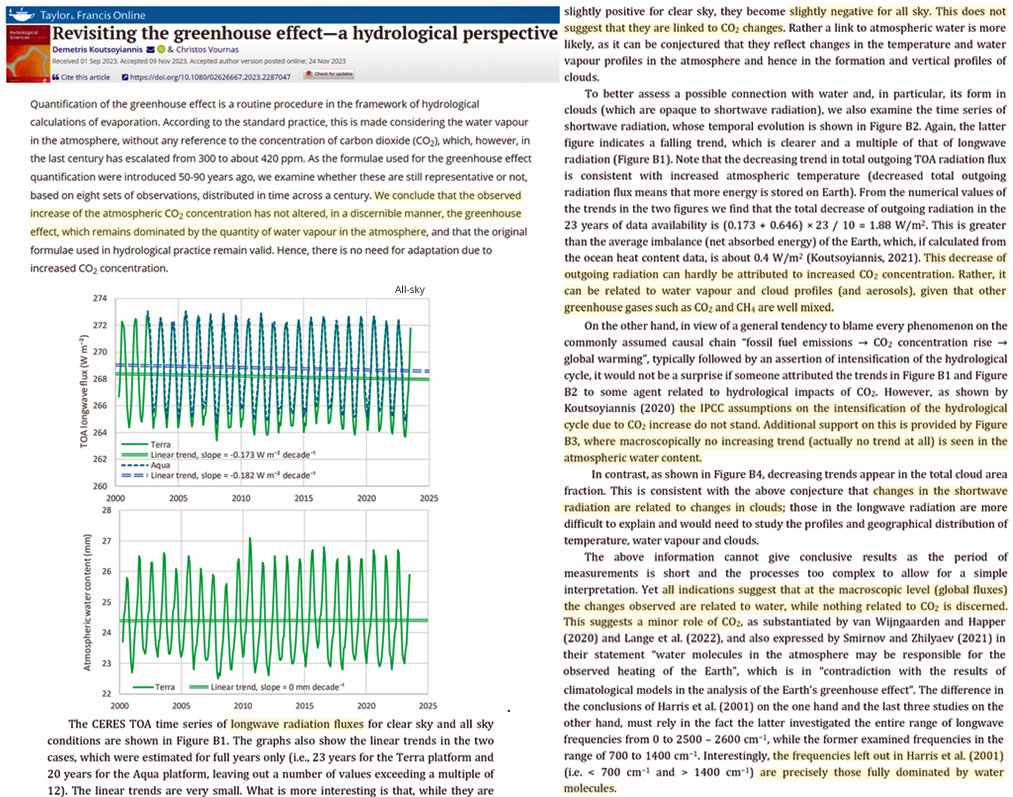
Koutsoyiannis and Vournas, 2023

An enhancement of the greenhouse effect, due to increasing CO2 concentration, through the years would be seen as a gradual displacement of the points from left to right with the progression of time. However, the alignment of the points of the different data sets does not show a gradual displacement from left to right. This means that the effect of the direct CO2 emission at the surface is smaller than the side effects…causing the variability in Figure 2, and thus it is impossible to discern. … Quantification of the greenhouse effect is a routine procedure in the framework of hydrological calculations of evaporation. According to the standard practice, this is made considering the water vapour in the atmosphere, without any reference to the concentration of carbon dioxide (CO2), which, however, in the last century has escalated from 300 to about 420 ppm. As the formulae used for the greenhouse effect quantification were introduced 50-90 years ago, we examine whether these are still representative or not, based on eight sets of observations, distributed in time across a century. We conclude that the observed increase of the atmospheric CO2 concentration has not altered, in a discernible manner, the greenhouse effect, which remains dominated by the quantity of water vapour in the atmosphere, and that the original formulae used in hydrological practice remain valid. Hence, there is no need for adaptation due to increased CO2 concentration.
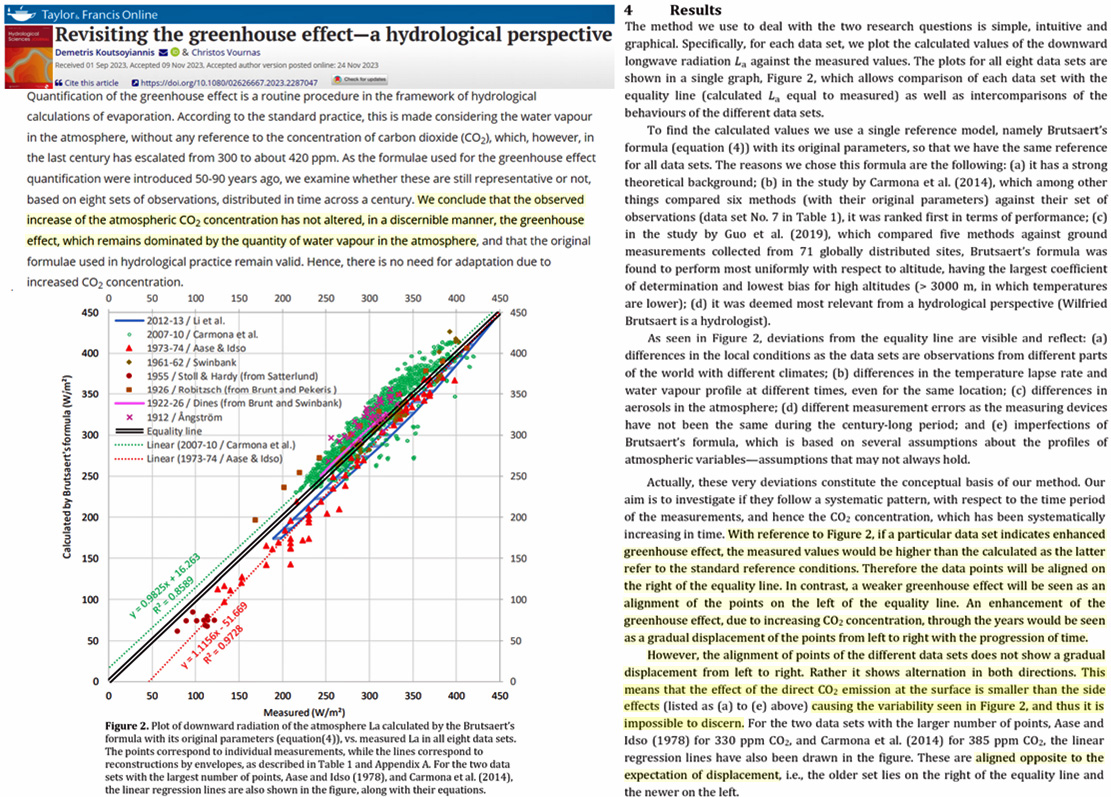
Germany’s Energy Sources Are Running Out As Biden Stops LNG Projects

Germany’s energy crisis deepens further due to Biden’s halt of U.S. LNG projects. Germany is backed into a corner after over-reliance on green energy.

The site of Germany LNG terminal, Wilhelmshaven, photographed in 2012. Later expanded in 2022. Image: RaBoe. CC BY-SA 3.0 de

Germany has dug itself into an energy hole

Due to the environmental and climate hysteria over the past decades, Germany has steadily moved to shut down its vast  fleet of nuclear reactors, coal power plants, and even natural gas supplies (a major supply line from Russia got blown up).

Moreover, Germany is moving to ban fossil fuel heating systems for homes, and mandating electric cars by 2035.

Now in an energy crunch

Since the supply of natural gas from Russia got cut off, it became necessary to find an alternative source quickly – from USA in the form of imported LNG. The German government approved the construction an LNG terminal at the north German coast in record time. This would help secure Germany’s energy supply. Surely the USA could be viewed as a reliable partner.

That was the plan – until President Joe Biden unexpectedly put a stop to further LNG projects. Now, Germany suddenly risks finding itself in energy isolation. It’s panic time in Berlin.

“Devastating energy crisis”

“Germany is facing a devastating energy crisis that seriously threatens its security of supply,” reports Germany’s Blackout News. “Biden’s decision now has far-reaching consequences that could pose serious problems for German energy policy.”

Also see. berliner-zeitung: 26.01.24

The USA is the world’s largest exporter of LNG, but because of climate protection, Biden bowed to pressure from climate radicals and stopped plans to build new export terminals. This development has sent shockwaves through energy-starved Germany.

According to US government officials, four U.S. terminal projects are directly affected Biden’s decision.

Berlin has backed itself into a corner with its years of misguided green energy policy. Now the chickens are coming home to roost.


Wood Pellets Aren’t CO2 Neutral, Emit More Than Coal… Double Of Natural Gas

Wood pellets are often viewed as an alternative, climate-friendly energy source, especially for heating. But an analysis shows this is not the case at all.

CO2 emitted [kg]. Data source: German Ministry of the Environment

Though it is claimed that the CO2 from burning biomass like trees remains in the natural carbon cycle, the  CO2-absorbing trees are often commercially chopped down, pelletized and burned, thus emitting years worth of CO2 sequestration in just a matter of hours. Live trees recapturing that same emitted CO2 and storing it in the form of biomass takes decades.

Wood emits the most

How much CO2 does the production of one megawatt-hour of energy emit by different fuels? This is answered at FB by the account Umwelt- und Klimathemen. They write:

Isn’t it almost the same whether I burn wood from a 150-year-old oak tree in pellet form in my heating system or whether I burn coal that has been in the ground for thousands of years? Both the wood and the coal release the carbon dioxide they once filtered out of the air when they burn.

According to the German Ministry of the Environment, burning wood produces even more carbon dioxide than fossil fuels such as coal and gas.
– 202 kg of carbon dioxide for natural gas
– 340 kg carbon dioxide for hard coal
– 403 kg carbon dioxide wood

But for the climate, it doesn’t matter where the carbon dioxide comes from!
That’s why heating with wood is not climate neutral!
Even if we make pellets from our wood, it is still wood that enriches our atmosphere with carbon dioxide when it is burned.”

Wood emits double the CO2 that natural gas does. Never mind the particulates burning wood entails.

Also related, see: Planet of the Humans


Germany’s “Spring In Winter” Lasted Weeks, Reached 15°C In January 1974!

Extended spring like weather also occurred in Europe 50 years ago

It’s been mild across Europe, bringing some relief from the hardships of winter. Yet, the media again is reporting the mild weather as if it’s something bad, which has never happened before. But of course, this is not true.

What follows is a newspaper clipping from January 14, 21974, published in ‘Die Welt‘:

Hat-tip: Michael Sehlert at Facebook

The Die Welt article reported 50 years ago (temps are in Celsius):

Spring in Winter – 15 degrees warm

The ‘spring in winter’, which has been ongoing for weeks, has reached a new high point on Sunday. The temperatures climbed in some Alps valleys and in the Bavarian lowland up to 15 degrees amid a strong foehn pattern. The thaw has reached to high elevations. Even on the Zugspitze, Germany’s tallest mountain, a sensational temperature of 0 degrees was reached in January. Up to 10 degrees was even measured at 2000 meters. The ski slopes at lower elevations were no longer usable.”

(But shhhhhhh….you’re not supposed to know this.)


New Study: 2001-2020 ‘Global Greening Is An Indisputable Fact’ And It’s Driven By CO2 Fertilization

“Our results showed that the global greening was still present in 2001–2020, with 55.15% of areas greening at an accelerated rate…compared with 7.28% of browning.” – Chen et al., 2024

The CO2 fertilization effect has been dominant driver of the global-scale increase in “leaf area index” (LAI), or greening, since the 1980s. Scientists have estimated that CO2’s photosynthesis-enhancing capacity is 70% responsible for the greening trend (Zhu et al., 2016).

Using Advanced Very High Resolution Radiometer (AVHRR) data sources of questionable quality, some recent studies have suggested the greening trend has slowed or has even been reversed to browning since the 21st century began. As suggested, these data sources “should be used in caution” (Chen et al., 2024) as it is “well known that AVHRR-based NDVI and LAI have multiple sources of uncertainty,” such as “obvious artificial signals from the orbital drift.”

Using much more reliable MODIS data, scientists (Chen et al., 2024) can now say the LAI trend in the 21st century is robustly positive, and that 2001-2020 “global greening is an indisputable fact.”

The satellite data indicate 55.15% of global areas are greening “at an accelerated rate,” whereas just 7.28% have undergone a browning trend since 2001.

CO2 fertilization is still the dominant (75.63%) driver of Earth’s 21st century greening trend. Any drought trends in recent decades cannot overtake the positive CO2 fertilization effect, as all drought can do is slightly slow down the acceleration of the CO2-induced greening trend.

Image Source: Chen et al., 2024

Simple Explanations Don’t Apply In The Complex Climate System

By Frank Bosse

During weather events, how often are we confronted with the simple claim: “More heat leads to more energy available, which leads to severe storms“?

This is so catchy that it can be understood with just a basic knowledge of physics.

So is the claim: “The warmer the tropical sea the more severe tropical storms, called hurricanes over the Atlantic or typhoons over the Pacific.” is often bandied about. The storms all occur over the ocean, and record surface temperatures were reported in 2023.

The temperatures (orange) already at the start of April 2023 were well above those of a year earlier . (Image: Climate Reanalyzer).  

Following this logic, the energy in storms in 2023 should also have been at a record level and there should have been more strong storms than ever before. And we did indeed see a record last year:

 Screenshot tweet by Ryan Maue (NOAA) at X.   

Since the beginning of systematic satellite-based observations in 1982, the number of severe tropical storms globally has never been as low as it was last year, in 2023. This contradiction between record-high ocean temperatures and record-low severe tropical storm numbers makes it clear that it is never as easy as often suggested. If you look at the relationship between the global ACE (for “accumulated cyclone energy” in storms) and the surface temperatures of the oceans, you will find the correlation is highly pronounced in the El Nino region, elsewhere there are only very unclear signatures.

This means: globally many storms with El Nino, few with La Nina. The image was generated with the KNMI Climate Explorer.

However, the oscillation there is natural and “modulates” the temperatures with a pattern in the Pacific tropics and subtropics with global effects. Note: In the real climate system, nothing is so simple that it can be explained with elementary school knowledge. Whoever tries to do this: you have to be particularly careful not to be manipulated.


NEW! 2023 Data: Pacific Typhoon Activity Calmed Considerably Past 7 Decades!

The data from Japan Meteorological Agency (JMA) Pacific typhoons formed and those making landfall in Japan are now available and have been tabulated by Tony Heller’s wife, Kirye

Result: no rising trend for the past 70 years!

The JMA’s data go back more than 7 decades, to 1951.

First we look at the latest data from the Japan Meteorological Agency (JMA) for the number of typhoons formed annually in the Pacific since 1951.

Data source: JMA here

Where’s the climate crisis? In the US or European data?

The linear trend for the number of typhoons has fallen some 10%.

Warmer and calmer Pacific

Contrary to the claims from alarmists, typhoons have in fact become less frequent. The trend has been clearly downward since the globe has been said to have warmed nearly 1°C.

Typhoons landfalling in Japan no trend

Next we look at the number of typhoons having made landfall in Japan:

Data source: JMA here

 The trend has been constant over the past 70 years. The model projections of more frequent and stronger tropical storms in the Pacific have turned out to be completely wrong.


New Study Concludes ‘CO2 Can Have No Measurable Effect On Ocean Temperatures’

“There can be no climate equilibrium state that can be perturbed by an increase in the atmospheric concentration of CO2…” – Clark, 2023

The anthropogenic global warming paradigm has a magnitude problem – especially when it comes to the assumption that we humans can warm the ocean with our CO2 emissions.

New research suggests the sensitivity of the ocean latent heat flux to wind speed is about 15 W/m² per meter per second, and the solar daily flux varies 1 to 2 megajoules per square meter per day (1-2 MJ m⁻² day−1).

In contrast, the total accumulated downward longwave flux to the surface from a 250-year CO2 concentration increase of 140 ppm is just 2 W/m², which translates to just 0.17 MJ m⁻² day−1. Thus, the impact from CO2 “can have no measurable effect on ocean temperatures.”

Not only this, but the depth of influence for downwelling longwave from greenhouse gases is only about 1/10th of a millimeter (0.1 mm, or 100 microns) at most. Wong and Minnett (2018) insist the depth of radiative effects for CO2 is ten times smaller than this: 0.01 mm (one-one-hundredth of a mm). Therefore, the 0.17 MJ m⁻² day−1 of CO2 influence “is simply absorbed within the within the first 100 micron ocean layer and dissipated as an insignificant part of the total surface cooling flux.”

Simply put, then, “there can be no ‘climate sensitivity’ to CO2.”

Image Source: Clark, 2023

Leading British Physician Says Going NetZero Would Probably Lead To 6 Billion Starving

Without fossil fuels,” we wouldn’t be able to feed the world”, distinguished scientist warns. We’ll be wrecking our lives the next decades.” 

British professor Angus Dalgleish, a Fellow of the Academy of Medical Sciences, and of the Royal College of Physicians, the Royal College of Pathologists and the Royal Australasian College of Physicians in an interview with Dr. John Campbell slams climate science and the media who distribute its fallacies.

Dagleish says that CO2 is a greening gas, and so offers many advantages, and that if we stopped using fossil fuels, we wouldn’t be able to feed the world.

Absolutely madness

“Nobody has thought this through,” Dagleish says, comparing NetZero to the pandemic lockdowns. “It’s absolutely madness if we constantly go to this.”

“The unintended consequences will be wrecking our lives, and those of our children and grandchildren, the next decades.”


Heat Becomes Unaffordable In Germany… Seniors Struggle, Staying Warm At Public Heating Places…

Energy poverty is spreading in Germany. Citizens, especially seniors, can no longer afford to heat their residences 

Blackout News reports on how German senior citizens, who, due to high energy prices, are being increasingly forced into a life of poverty and struggling to keep warm at home.

“Many pensioners can no longer pay heating costs and so they spend time at so called warming places,” like charitable organizations. It’s just too expensive to pay for heat at home.Bild also reports here.
“Older Berlin pensioners are struggling with high heating costs and cold homes,” writes Blackout News.

Many pensioners are having difficulty coping with paying their rent and high heating costs, many with a pension of well under 1,000 euros.

Recently one leading German politician, Ricarda Lang (Greens) embarrassed herself on German television when she said she thought the average German pensioner earned 2000 euros a month. The average in fact is just 1500 euros.

Soup kitchens and warming places

Sigrid Johannes, 84 years old, says she has to set the heat in her living room on low and doesn’t heat the other rooms. “I’m out and about all day, in the soup kitchen at lunchtime, and at a warming place in the afternoon. In the evening, I snuggle up in a thick blanket to save money,” reports Blackout News.”

Germany’s energy situation is so bad, in fact, that in November, 2022, the “Network of Warmth” was founded in Berlin. “Almost 358 facilities offer warmth for people struggling with high energy costs.”

Meanwhile, the government is doing nothing to make heating energy cheaper.

Nine times deadlier

Climate scammers like to claim that warmth in fact kills, and so think the mean temperature of the earth ought to go back to where it was in the 1960s and 70s, a cold time when the media fretted about the next ice age.

But, as Björn Lomborg here points out at X, cold actually kills nine times more people than heat.


By continuing to use the site, you agree to the use of cookies. more information

The cookie settings on this website are set to "allow cookies" to give you the best browsing experience possible. If you continue to use this website without changing your cookie settings or you click "Accept" below then you are consenting to this. More information at our Data Privacy Policy

Close