Wood Pellets Aren't CO2 Neutral, Emit More Than Coal... Double Of Natural Gas

Wood Pellets Aren’t CO2 Neutral, Emit More Than Coal… Double Of Natural Gas

Wood pellets are often viewed as an alternative, climate-friendly energy source, especially for heating. But an analysis shows this is not the case at all.

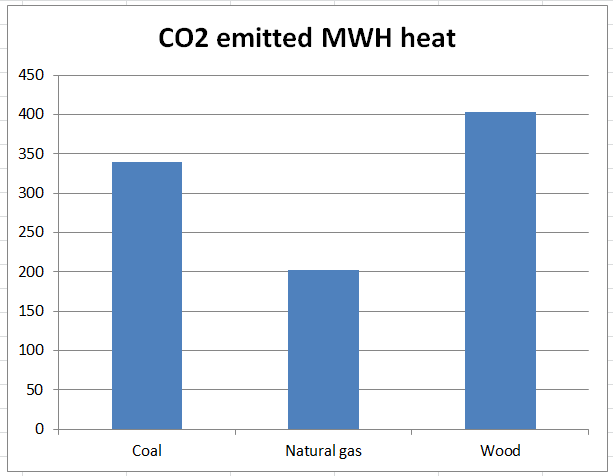
CO2 emitted [kg]. Data source: German Ministry of the Environment

Though it is claimed that the CO2 from burning biomass like trees remains in the natural carbon cycle, the  CO2-absorbing trees are often commercially chopped down, pelletized and burned, thus emitting years worth of CO2 sequestration in just a matter of hours. Live trees recapturing that same emitted CO2 and storing it in the form of biomass takes decades.

Wood emits the most

How much CO2 does the production of one megawatt-hour of energy emit by different fuels? This is answered at FB by the account Umwelt- und Klimathemen. They write:

Isn’t it almost the same whether I burn wood from a 150-year-old oak tree in pellet form in my heating system or whether I burn coal that has been in the ground for thousands of years? Both the wood and the coal release the carbon dioxide they once filtered out of the air when they burn.

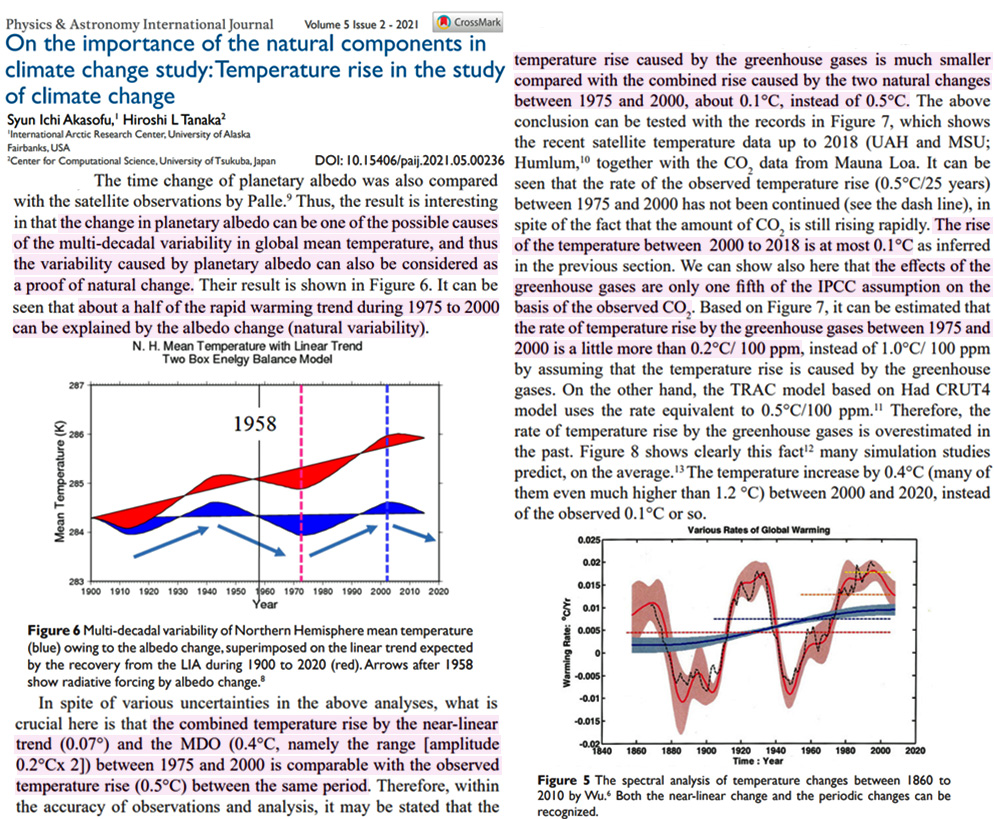
According to the German Ministry of the Environment, burning wood produces even more carbon dioxide than fossil fuels such as coal and gas.
– 202 kg of carbon dioxide for natural gas
– 340 kg carbon dioxide for hard coal
– 403 kg carbon dioxide wood

But for the climate, it doesn’t matter where the carbon dioxide comes from!
That’s why heating with wood is not climate neutral!
Even if we make pellets from our wood, it is still wood that enriches our atmosphere with carbon dioxide when it is burned.”

Wood emits double the CO2 that natural gas does. Never mind the particulates burning wood entails.

Also related, see: Planet of the Humans


Germany’s “Spring In Winter” Lasted Weeks, Reached 15°C In January 1974!

Extended spring like weather also occurred in Europe 50 years ago

It’s been mild across Europe, bringing some relief from the hardships of winter. Yet, the media again is reporting the mild weather as if it’s something bad, which has never happened before. But of course, this is not true.

What follows is a newspaper clipping from January 14, 21974, published in ‘Die Welt‘:

Hat-tip: Michael Sehlert at Facebook

The Die Welt article reported 50 years ago (temps are in Celsius):

Spring in Winter – 15 degrees warm

The ‘spring in winter’, which has been ongoing for weeks, has reached a new high point on Sunday. The temperatures climbed in some Alps valleys and in the Bavarian lowland up to 15 degrees amid a strong foehn pattern. The thaw has reached to high elevations. Even on the Zugspitze, Germany’s tallest mountain, a sensational temperature of 0 degrees was reached in January. Up to 10 degrees was even measured at 2000 meters. The ski slopes at lower elevations were no longer usable.”

(But shhhhhhh….you’re not supposed to know this.)


New Study: 2001-2020 ‘Global Greening Is An Indisputable Fact’ And It’s Driven By CO2 Fertilization

“Our results showed that the global greening was still present in 2001–2020, with 55.15% of areas greening at an accelerated rate…compared with 7.28% of browning.” – Chen et al., 2024

The CO2 fertilization effect has been dominant driver of the global-scale increase in “leaf area index” (LAI), or greening, since the 1980s. Scientists have estimated that CO2’s photosynthesis-enhancing capacity is 70% responsible for the greening trend (Zhu et al., 2016).

Using Advanced Very High Resolution Radiometer (AVHRR) data sources of questionable quality, some recent studies have suggested the greening trend has slowed or has even been reversed to browning since the 21st century began. As suggested, these data sources “should be used in caution” (Chen et al., 2024) as it is “well known that AVHRR-based NDVI and LAI have multiple sources of uncertainty,” such as “obvious artificial signals from the orbital drift.”

Using much more reliable MODIS data, scientists (Chen et al., 2024) can now say the LAI trend in the 21st century is robustly positive, and that 2001-2020 “global greening is an indisputable fact.”

The satellite data indicate 55.15% of global areas are greening “at an accelerated rate,” whereas just 7.28% have undergone a browning trend since 2001.

CO2 fertilization is still the dominant (75.63%) driver of Earth’s 21st century greening trend. Any drought trends in recent decades cannot overtake the positive CO2 fertilization effect, as all drought can do is slightly slow down the acceleration of the CO2-induced greening trend.

Image Source: Chen et al., 2024

Simple Explanations Don’t Apply In The Complex Climate System

By Frank Bosse

During weather events, how often are we confronted with the simple claim: “More heat leads to more energy available, which leads to severe storms“?

This is so catchy that it can be understood with just a basic knowledge of physics.

So is the claim: “The warmer the tropical sea the more severe tropical storms, called hurricanes over the Atlantic or typhoons over the Pacific.” is often bandied about. The storms all occur over the ocean, and record surface temperatures were reported in 2023.

The temperatures (orange) already at the start of April 2023 were well above those of a year earlier . (Image: Climate Reanalyzer).  

Following this logic, the energy in storms in 2023 should also have been at a record level and there should have been more strong storms than ever before. And we did indeed see a record last year:

 Screenshot tweet by Ryan Maue (NOAA) at X.   

Since the beginning of systematic satellite-based observations in 1982, the number of severe tropical storms globally has never been as low as it was last year, in 2023. This contradiction between record-high ocean temperatures and record-low severe tropical storm numbers makes it clear that it is never as easy as often suggested. If you look at the relationship between the global ACE (for “accumulated cyclone energy” in storms) and the surface temperatures of the oceans, you will find the correlation is highly pronounced in the El Nino region, elsewhere there are only very unclear signatures.

This means: globally many storms with El Nino, few with La Nina. The image was generated with the KNMI Climate Explorer.

However, the oscillation there is natural and “modulates” the temperatures with a pattern in the Pacific tropics and subtropics with global effects. Note: In the real climate system, nothing is so simple that it can be explained with elementary school knowledge. Whoever tries to do this: you have to be particularly careful not to be manipulated.


NEW! 2023 Data: Pacific Typhoon Activity Calmed Considerably Past 7 Decades!

The data from Japan Meteorological Agency (JMA) Pacific typhoons formed and those making landfall in Japan are now available and have been tabulated by Tony Heller’s wife, Kirye

Result: no rising trend for the past 70 years!

The JMA’s data go back more than 7 decades, to 1951.

First we look at the latest data from the Japan Meteorological Agency (JMA) for the number of typhoons formed annually in the Pacific since 1951.

Data source: JMA here

Where’s the climate crisis? In the US or European data?

The linear trend for the number of typhoons has fallen some 10%.

Warmer and calmer Pacific

Contrary to the claims from alarmists, typhoons have in fact become less frequent. The trend has been clearly downward since the globe has been said to have warmed nearly 1°C.

Typhoons landfalling in Japan no trend

Next we look at the number of typhoons having made landfall in Japan:

Data source: JMA here

 The trend has been constant over the past 70 years. The model projections of more frequent and stronger tropical storms in the Pacific have turned out to be completely wrong.


New Study Concludes ‘CO2 Can Have No Measurable Effect On Ocean Temperatures’

“There can be no climate equilibrium state that can be perturbed by an increase in the atmospheric concentration of CO2…” – Clark, 2023

The anthropogenic global warming paradigm has a magnitude problem – especially when it comes to the assumption that we humans can warm the ocean with our CO2 emissions.

New research suggests the sensitivity of the ocean latent heat flux to wind speed is about 15 W/m² per meter per second, and the solar daily flux varies 1 to 2 megajoules per square meter per day (1-2 MJ m⁻² day−1).

In contrast, the total accumulated downward longwave flux to the surface from a 250-year CO2 concentration increase of 140 ppm is just 2 W/m², which translates to just 0.17 MJ m⁻² day−1. Thus, the impact from CO2 “can have no measurable effect on ocean temperatures.”

Not only this, but the depth of influence for downwelling longwave from greenhouse gases is only about 1/10th of a millimeter (0.1 mm, or 100 microns) at most. Wong and Minnett (2018) insist the depth of radiative effects for CO2 is ten times smaller than this: 0.01 mm (one-one-hundredth of a mm). Therefore, the 0.17 MJ m⁻² day−1 of CO2 influence “is simply absorbed within the within the first 100 micron ocean layer and dissipated as an insignificant part of the total surface cooling flux.”

Simply put, then, “there can be no ‘climate sensitivity’ to CO2.”

Image Source: Clark, 2023

Leading British Physician Says Going NetZero Would Probably Lead To 6 Billion Starving

Without fossil fuels,” we wouldn’t be able to feed the world”, distinguished scientist warns. We’ll be wrecking our lives the next decades.” 

British professor Angus Dalgleish, a Fellow of the Academy of Medical Sciences, and of the Royal College of Physicians, the Royal College of Pathologists and the Royal Australasian College of Physicians in an interview with Dr. John Campbell slams climate science and the media who distribute its fallacies.

Dagleish says that CO2 is a greening gas, and so offers many advantages, and that if we stopped using fossil fuels, we wouldn’t be able to feed the world.

Absolutely madness

“Nobody has thought this through,” Dagleish says, comparing NetZero to the pandemic lockdowns. “It’s absolutely madness if we constantly go to this.”

“The unintended consequences will be wrecking our lives, and those of our children and grandchildren, the next decades.”


Heat Becomes Unaffordable In Germany… Seniors Struggle, Staying Warm At Public Heating Places…

Energy poverty is spreading in Germany. Citizens, especially seniors, can no longer afford to heat their residences 

Blackout News reports on how German senior citizens, who, due to high energy prices, are being increasingly forced into a life of poverty and struggling to keep warm at home.

“Many pensioners can no longer pay heating costs and so they spend time at so called warming places,” like charitable organizations. It’s just too expensive to pay for heat at home.Bild also reports here.
“Older Berlin pensioners are struggling with high heating costs and cold homes,” writes Blackout News.

Many pensioners are having difficulty coping with paying their rent and high heating costs, many with a pension of well under 1,000 euros.

Recently one leading German politician, Ricarda Lang (Greens) embarrassed herself on German television when she said she thought the average German pensioner earned 2000 euros a month. The average in fact is just 1500 euros.

Soup kitchens and warming places

Sigrid Johannes, 84 years old, says she has to set the heat in her living room on low and doesn’t heat the other rooms. “I’m out and about all day, in the soup kitchen at lunchtime, and at a warming place in the afternoon. In the evening, I snuggle up in a thick blanket to save money,” reports Blackout News.”

Germany’s energy situation is so bad, in fact, that in November, 2022, the “Network of Warmth” was founded in Berlin. “Almost 358 facilities offer warmth for people struggling with high energy costs.”

Meanwhile, the government is doing nothing to make heating energy cheaper.

Nine times deadlier

Climate scammers like to claim that warmth in fact kills, and so think the mean temperature of the earth ought to go back to where it was in the 1960s and 70s, a cold time when the media fretted about the next ice age.

But, as Björn Lomborg here points out at X, cold actually kills nine times more people than heat.


New Journal of Climate Study Reduces Doubled CO2 Climate Sensitivity By 40%, To 0.72°C

Doubling the 2005 CO2 concentration (380 ppm) to 760 ppm only produces a globally-averaged 2.26 W/m² perturbation at the top of the atmosphere (TOA). This doubled-CO2 forcing is close to 0 W/m² for large portions of the globe – including below 0 W/m² for Antarctica.

The IPCC claims doubling CO2 produces a 3.7 W/m² TOA forcing, which is a 1.2°C direct (no feedback) temperature differential using the IPCC’s 0.32°C per 1 W/m² formula (Seinfeld, 2008).

Image Source: Seinfeld, 2008

A new study (Chen et al., 2023) published in Journal of Climate assesses doubling CO2 from 380 to 760 ppm only yields 2.26 W/m², 1.71 W/m², and 0.55 W/m² forcing at the TOA, surface, and troposphere, respectively. These forcing values represent 0.72°C, 0.55°C, and 0.18°C temperature differentials, respectively (0.32°C/W/m²).

The global mean surface temperature forcing for doubled CO2, 0.55°C, would by itself appear to already cast doubt on claims that all or nearly all of the post-1850 >1°C warming could have been driven by anthropogenic CO2 forcing.

Image Source: Chen et al., 2023

The 2.26 W/m² globally averaged TOA forcing identified in this paper is 39% lower than the IPCC’s globally-averaged estimate (3.7 W/m²).

CO2 forcing is identified as highly variable and latitudinally dependent. At some locations, such as over Antarctica, doubled CO2 TOA forcing is negative, or below 0 W/m².

“The [doubled CO2] forcing in polar regions is strongly hemispheric asymmetric and is negative in the Antarctic.”

This means that, as CO2 increases, its impact actually cools Antarctica. This contradicts the IPCC claim that CO2 climate sensitivity is amplified at the poles. It also undermines the alarmist claim that Antarctic ice melt (and consequent catastrophic sea level rise) is driven by CO2.

Chen and colleagues also report that CO2 has no effect on atmospheric transmissivity due to (a) absorption saturation (CO2 can have no effect beyond a pre-industrial concentration), and because (b) water vapor and cloud forcing overlap and thus dominate absorption in CO2’s band.

“[Transmissivity] in the CO2 band center is unchanged by increased CO2 as the absorption is already saturated…”

“[T]he water vapor and CO2 overlapping at an absorbing band prevents absorption by additional CO2.”

Finally, water vapor serves to “dampen” the warming effect of increased CO2, which calls into question the IPCC’s water vapor “positive feedback” claims.

“The water vapor usually damps the [doubled CO2] forcing by reducing the energy additional CO2 can absorb.”

Because this is a mainstream study published in a prestigious climate-focused journal, perhaps it may not be as readily dismissed by gatekeepers of the anthropogenic global warming (AGW) paradigm.

Models Wrong Again: “Hotter Weather Not Diminishing Runoff, River Discharge”!

“Results are somewhat in contrast to climate projections”

Hat-tip: Klimanachrichten

The reports on runoff and river discharge, which are important components in Earth’s water cycle.

With the globe allegedly warming, drought and heatwaves are said to be more frequent and so the hotter climate should lead to reduced water runoff and river discharge. But scientists, using data from satellites, are finding out “this isn’t always the case.”

Runoff occurs when the soil is saturated and has lost its capacity to soak up any more water. The water is then forced to flow over land until it reaches a stream or a river. River discharge describes the volume of water flowing per second at a given point along a river.

ESA says that river discharge is an indicator of climate change and trends on this can be derived from . In these days of climate panic, many scientists believe that heat and drought will lead to drier soils and so less runoff into rivers.

Hotter weather not diminishing runoff and river discharge as expected
The map shows soil moisture during February 2023 compared to the reference period of 1995–2022. It is clear to see that Turkey is particularly dry, but so too are parts of the UK, Ireland, the Netherlands, Belgium much of France. Credit: ESA (data source: GDO, CEMS)

The Hydrology Group of the Italian National Research Council has developed an innovative approach using satellite observations of terrestrial water storage, and precipitation to predict runoff and river discharge. The results were published in the Geoscientific Model Development journal.

The team of scientists led by Stefania Camici of the National Research Council of Italy, found that “runoff is also increasing parts of southern Europe, including central Italy, Sardinia, Corsica and the in the Pyrenees.”

Much of northern Europe had been stricken by drought over the 2018-2022 period, and so runoff and river discharge decreased. But the heavy rains of late 2023 have literally erased the low runoff situation. Soil saturation and river discharge are high

The ESA reports on their results:

Dr. Camici commented, ‘These results are somewhat in contrast to climate projections, where runoff is expected to decrease only over southern Europe. While these results need to be further validated and cross-checked, they open up interesting new activities for hydrological research in the near future.’ “

Conclusion: Don’t trust the climate forecasters! They are having a tough time understanding what’s really going on, wrongly assume lots of things in their models, and so end up suggesting absurd policy decisions.

Entire ESA article here.


Tokyo Annual Temperature Trend Hasn’t Seen Any Warming In Decades!

Tokyo and Hachijō-jima island haven’t seen any warming in over 25 years, the Japan Meteorological Agency data show.

Charts by Kirye

The mean temperature data for 2023, for the city of Tokyo, Japan, and its Hachijō-jima island in the Pacific are now available from the Japan Meteorological Agency (JMA).

First we look at latest annual mean temperature plots for Tokyo since 1997:

Data: JMA.

Tokyo has in fact cooled modestly since 1997 – despite the the relatively warm reading for 2023 and the city’s massive urban heat island (UHI) effect.

Hachijō-jima sees decades of no change

Moving offshore to the Tokyo island of Hachijō-jima, away from all the massive urban heat island affects, we look at the latest mean annual temperature data going back to 1977.

Data: JMA.

For Hachijō-jima, 2023 saw a mean temperature of 18.9°C, the highest in about 25 years. Yet, there’s been no warming trend since 1977.

According to the high quality data from the JMA, there’s been no real climate change in decades in neither Tokyo nor Hachijojima, let alone any signs of a climate crisis.


Nearly 160 Scientific Papers Detail The Minuscule Effect CO2 Has On Earth’s Temperature

We have updated our “Extremely Low CO2 Climate Sensitivity” scientific paper list with new papers added from 2022 and 2023 and some newly discovered papers from the past.

As of 2016 this list had only 50 papers on it (as indicated by the web address). In less than 8 years the list has grown to 159 (as of today).

Click on the link for the full list.

160 Papers Find Extremely Low CO2 Climate Sensitivity

A few of the sample 2022 and 2023 papers are shown here.

Akasofu and Tanaka, 2022  (100 ppm CO2 = 0.2°C global temperature change)

In spite of various uncertainties in the above analyses, what is crucial here is that the combined temperature rise by the near-linear trend (0.07°) and the MDO (0.4°C, namely the range [amplitude 0.2°Cx 2]) between 1975 and 2000 is comparable with the observed temperature rise (0.5°C) between the same period. Therefore, within the accuracy of observations and analysis, it may be stated that the temperature rise caused by the greenhouse gases is much smaller compared with the combined rise caused by the two natural changes between 1975 and 2000, about 0.1°C, instead of 0.5°C. The above conclusion can be tested with the records in Figure 7, which shows the recent satellite temperature data up to 2018 (UAH and MSU; Humlum,10 together with the CO2 data from Mauna Loa. It can be seen that the rate of the observed temperature rise (0.5°C/25 years) between 1975 and 2000 has not been continued (see the dash line), in spite of the fact that the amount of CO2 is still rising rapidly. The rise of the temperature between 2000 to 2018 is at most 0.1°C as inferred in the previous section. We can show also here that the effects of the greenhouse gases are only one fifth of the IPCC assumption on the basis of the observed CO2. Based on Figure 7, it can be estimated that the rate of temperature rise by the greenhouse gases between 1975 and 2000 is a little more than 0.2°C/ 100 ppm, instead of 1.0°C/ 100 ppm by assuming that the temperature rise is caused by the greenhouse gases. On the other hand, the TRAC model based on Had CRUT4 model uses the rate equivalent to 0.5°C/100 ppm. Therefore, the rate of temperature rise by the greenhouse gases is overestimated in the past. Figure 8 shows clearly this fact many simulation studies predict, on the average. The temperature increase by 0.4°C (many of them even much higher than 1.2 °C) between 2000 and 2020, instead of the observed 0.1°C or so.


Koutsoyiannis and Vournas, 2023

An enhancement of the greenhouse effect, due to increasing CO2 concentration, through the years would be seen as a gradual displacement of the points from left to right with the progression of time. However, the alignment of the points of the different data sets does not show a gradual displacement from left to right. This means that the effect of the direct CO2 emission at the surface is smaller than the side effects…causing the variability in Figure 2, and thus it is impossible to discern. … Quantification of the greenhouse effect is a routine procedure in the framework of hydrological calculations of evaporation. According to the standard practice, this is made considering the water vapour in the atmosphere, without any reference to the concentration of carbon dioxide (CO2), which, however, in the last century has escalated from 300 to about 420 ppm. As the formulae used for the greenhouse effect quantification were introduced 50-90 years ago, we examine whether these are still representative or not, based on eight sets of observations, distributed in time across a century. We conclude that the observed increase of the atmospheric CO2 concentration has not altered, in a discernible manner, the greenhouse effect, which remains dominated by the quantity of water vapour in the atmosphere, and that the original formulae used in hydrological practice remain valid. Hence, there is no need for adaptation due to increased CO2 concentration.


Harde and Schnell, 2022 (2XCO2 = 0.7°C)

The derived forcing for CO2 is in quite good agreement with some theoretical studies in the literature, which to some degree is the result of calibrating the set-up to the spectral calculations, but independently it determines and also reproduces the whole progression as a function of the gas concentration. From this we deduce a basic equilibrium climate sensitivity (without feedbacks) of ECSB = 1.05°C. When additionally assuming a reduced wing absorption of the spectral lines due to a finite collision time of the molecules this further reduces the ECSB by 10% and, thus, is 20% smaller than recommended by CMIP6 with 1.22°C. … Detailed own investigations also show that in contrast to the assumptions of the IPCC water vapor only contributes to a marginal positive feedback and evaporation at the earth’s surface even leads to a significant further reduction of the climate sensitivity to only ECS = 0.7°C (Harde 2017 [15]). This is less than a quarter of the IPCC’s last specification with 3°C (see AR6 [1]) and even 5.4x lower than the mean value of CMIP6 with ECS = 3.78°C. The presented measurements and calculations clearly confirm the existence of an atmospheric GHE, but they also demonstrate the only small impact on global warming, which apparently is much more dominated by natural impacts like solar radiative forcing (see, e.g., Connolly et al. 2021 [16]; Harde 2022 [17]).


Siem and Olsen, 2023 (CO2 rising from 400 ppm to 1,000,000 ppm = -0.22°C cooling)

This study deals with interactions between thermal and radiative energy flow in experimental situations of varying complexity. Of special interest is how IR energy, re-emitted from CO2 gas, behaves in an earth/atmosphere simulated setup. Such an experiment was performed by Hermann Harde and Michael Schnell where they show that IR radiation emitted from CO2 can warm a small black-body metal plate. In a control experiment, we verified this result. However, in their experiment, the amount of IR radiation from the heating element was strongly attenuated. In a modified experiment, where IR emission from the heating source is present, no heating but a slight cooling  [the average cooling was found to be -0.22°C±0.03°C] of a black object is found when air [0.04%] is replaced by CO2 [100%]. The modified experimental situation is also more like the earth/atmosphere situation.

By continuing to use the site, you agree to the use of cookies. more information

The cookie settings on this website are set to "allow cookies" to give you the best browsing experience possible. If you continue to use this website without changing your cookie settings or you click "Accept" below then you are consenting to this. More information at our Data Privacy Policy

Close