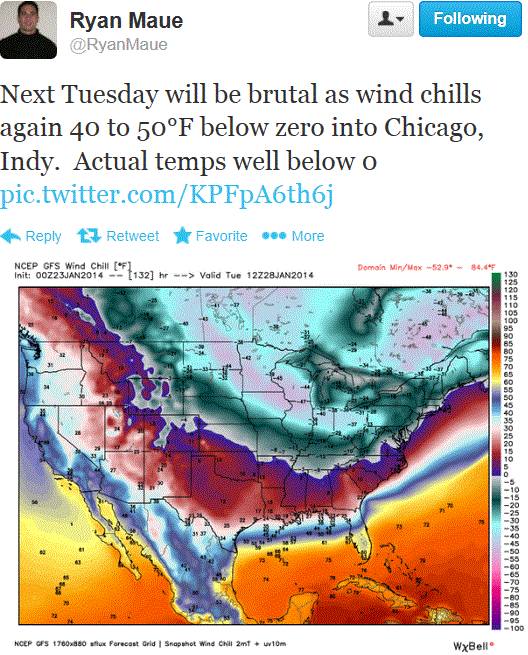
Chart cropped from: twitter.com/RyanMaue/8.
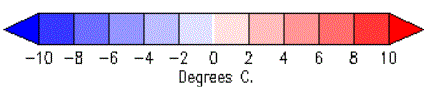
TEMPERATURE ANOMALIES
USA next 7 days:

Europe next 7 days:
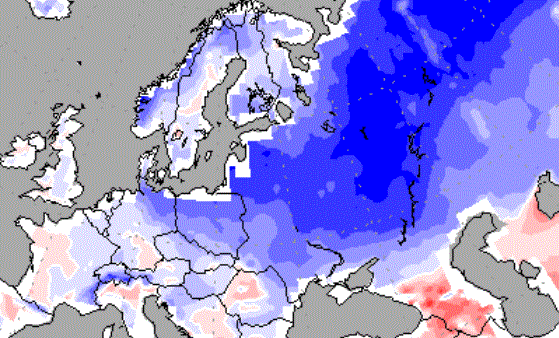
Above 2 charts cropped from: http://wxmaps.org.html, 23 Jan 2014.
Also see twitter.com/BigJoeBastardi/status/426304647255453696.
Chart cropped from: twitter.com/RyanMaue/8.
TEMPERATURE ANOMALIES
USA next 7 days:
Europe next 7 days:
Above 2 charts cropped from: http://wxmaps.org.html, 23 Jan 2014.
Also see twitter.com/BigJoeBastardi/status/426304647255453696.


By continuing to use the site, you agree to the use of cookies. more information
The cookie settings on this website are set to "allow cookies" to give you the best browsing experience possible. If you continue to use this website without changing your cookie settings or you click "Accept" below then you are consenting to this. More information at our Data Privacy Policy
Now we can all sing, “We’re having a heat wave, a tropical heat wave; it isn’t surprising, the temperature’s rising…” (Irving Berlin, 1933)
Seriously – this is not good—for anyone.
The water line to the refrigerator ice maker has been frozen for a week. It runs in an outside wall for a few feet. We are two inches (5cm) from an all time local snow record for January. We will blow by that tonight. In blizzard conditions. (Pun intended. Detroit metro area.)
Here in tropical Manila, we experienced 16.9 C this morning, the coldest so far since 1987. Last week, famous mountain city Baguio, experienced 8.1 C. http://funwithgovernment.blogspot.com/2014/01/global-warming-hits-philippines-part-3_25.html
Ask…….
http://www.usatoday.com/story/weather/2014/01/23/alaska-warm-weather/4798481/
…..and you shall receive my son:)
Ask again….
http://cci-reanalyzer.org/DailySummary/index_ds.php
….and you shall receive again my son:)
I wonder why it is called “global warming”? Aren’t facts wonderful…..
“I wonder why it is called “global warming”? ”
Because it is about computing the average global temperature.
Der Spiegel, 1990: 15.5 deg C.
NCDC, NOV 2013: 13.96 deg C.
In 2013 , past temperature time series had been manipulated enough to make it appear as if warming had happened, though…
I didn’t realize you guys look at actual science. This link shows two anomaly maps: The top one shows the air temperature anomaly map, and the second one shows the sea surface temperature anomaly.
http://climatechangegraphs.blogspot.com/2013/02/sea-surface-temperature-anomaly-weekly.html
Yes, Buddy, we look at actual science.
http://data.giss.nasa.gov/cgi-bin/gistemp/nmaps.cgi?year_last=2013&month_last=12&sat=4&sst=3&type=trends&mean_gen=0112&year1=2005&year2=2013&base1=1951&base2=1980&radius=250&pol=rob