By Kirye
Increasing CO2 in the atmosphere is supposed to be trapping heat and thus warming the global temperature.
But when we look at the Japan Meteorological Agency (JMA) statistics from my home country of Japan, one does not find any such warming over the recent decades.
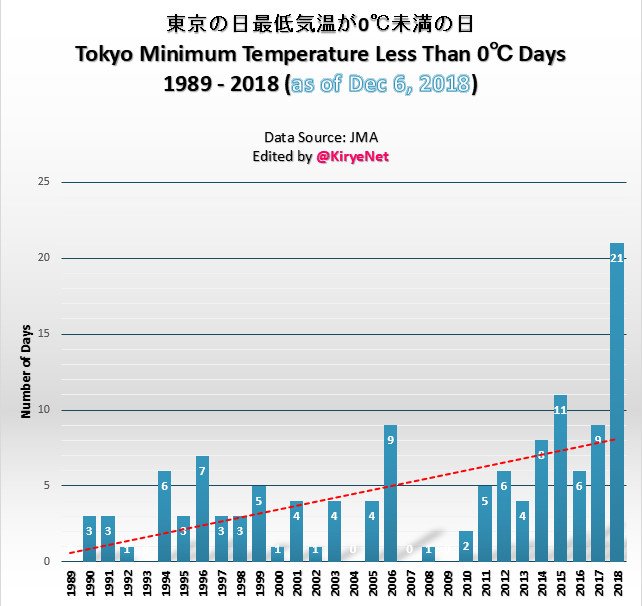
I looked at the number of so-called cold days in Tokyo, i.e. days on which the thermometer dropped to 0°C and colder. Surprisingly over the past 30 years the trend has been more cold days, and not less:
Data source: JMA
Next I looked at the rural station of Miyama near Kyoto. This station shows a decreasing number of cold days trend since the data there began:
Data source: JMA
However, when we look at the past 34 years, a period when experts said in the late 1980s we’d see great warming, the opposite has in fact occurred:
Data source: JMA
The number of cold days at Miyama has since been on the rise. And if I started the chart at 1989 (30 years), the upward trend would be even more impressive.
Now moving far north to Hokkaido to the station of Suttsu, we also find the trend is the same over the past 30 years: we are seeing more cold days, and not less as we’d expect from a warming planet:
Data source: JMA
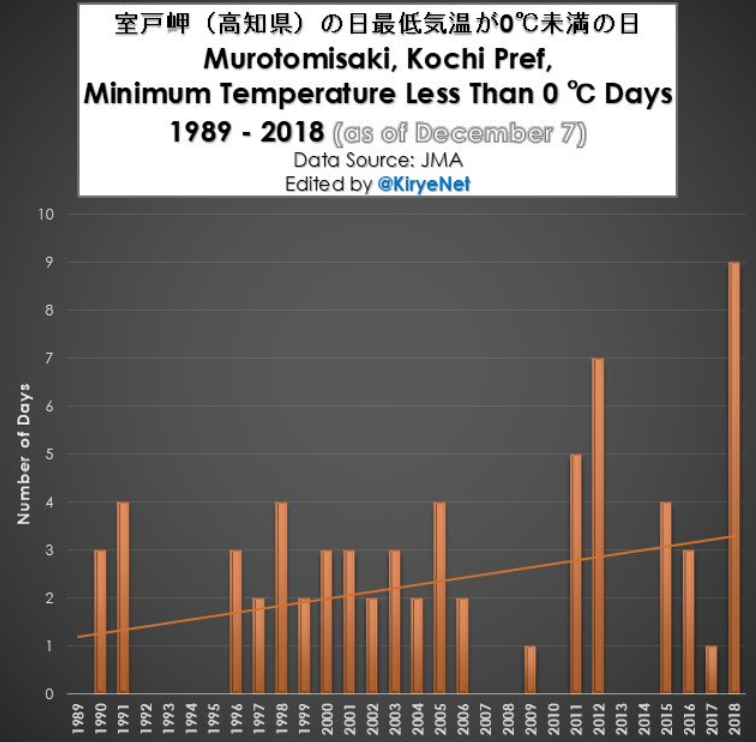
Moving to Kochu Prefecture to Murotomisaki station, here as well we find no downward trend for cold days. Cold days are on the rise:
Data source: JMA
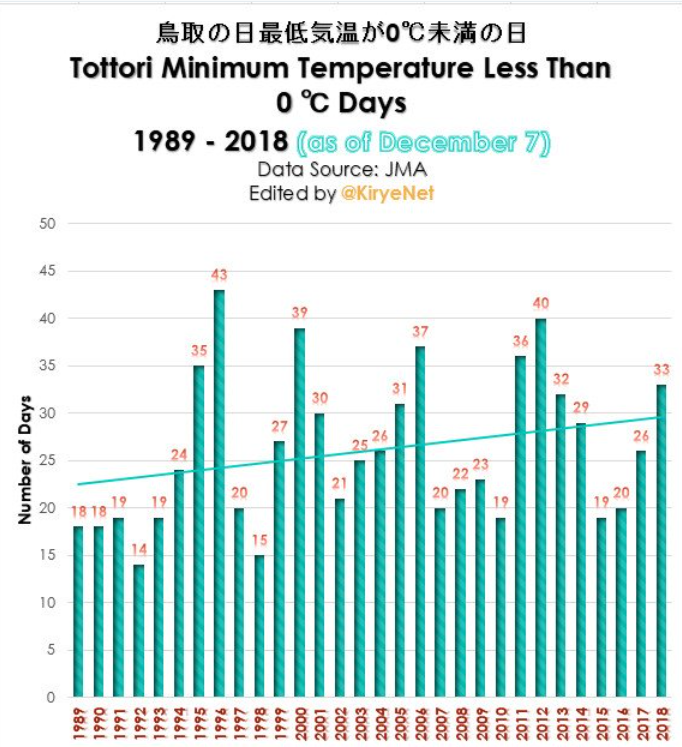
Also the station of Tottori has been seeing an upward trend in the number of cold days over the past 30 years:
Data source: JMA.
90% no warming!
Of course over the past 200 years there has been a long term warming as the planet climbed out of the Little Ice Age. But overall over the past 3 decades, Japan has been seeing an increase in cold days. This should not come as a surprise because recently we found out that 90% of all rural sited stations in Japan have shown no warming trend, or even cooling, over the past 20 years.
The data show here has been no warming in Japan, and leaders need to finally acknowledge this.
Obviously natural factors are overwhelming CO2’s (modest) greenhouse effect.


It would be interesting to see the same analysis for countries across the world. Is it possible that that there are countries with less cold days over the last 30 years, and some others with more?
Could make an informative picture.
@Mike
Here Tony Heller explains how and why the data has been manipulated, and that they knew what they were doing. It’s being done worldwide in conjunction with American and British climatologists.
https://www.youtube.com/watch?v=dC_fVuJWZoY
Here he gives more detail
https://realclimatescience.com/2016/12/100-of-us-warming-is-due-to-noaa-data-tampering/
Another with more info on how they make data up worldwide.
https://realclimatescience.com/2017/02/nasa-noaa-climate-data-is-fake-data/
And, if you haven’t seen it yet, Dr. Keen on the importance of data integrity, and how careless the warmists are with it.
https://youtu.be/Gmc5w2I-FCA
And then there’s “homogenization,” where they have computer algorithms to adjust temps from what they are to what they “should” be, when they aren’t just making them up. Here’s how that plays out in Australia.
https://www.youtube.com/watch?v=3ge9Nwu8MxE
Yes indeed! It would not surprise me in the least to find that there are places in the world which buck the general trend – whatever that might be.
However, should we really be looking at only cold days? Why not look at hot ones too? It seems to me that it would be more sensible to look at changes in the annual and seasonal average temperatures over the last several years.
I have done this for Japan using both the unadjusted data from the GHCN database as well as using the Berkeley Earth data for Japan, (which sadly stops midway through 2013).
On an annual basis, I find that the rate of warming for the period 2000-2012 is considerably less than that for the period 1970-1999, (at 48.4% for BEST and 15.28% for GHCN). If CO2 were the main driver, then we would expect the later period to warm faster than the earlier one. If we take the BEST data for 1979-2012 we find that summer is supposedly warming faster than winter. Standard AGW theory predicts that the opposite should be the case!
Of course, this is only one country . . . . . . .
See also here.
https://notrickszone.com/2018/09/04/software-expert-new-york-times-committing-massive-fraud-and-hiding-all-temperature-data-before-1960/
“Obviously natural factors are overwhelming CO2’s (modest) greenhouse effect.”
The overwhelming factor right now is the great deal of water vapor in the atmosphere. It is the natural factor that is driving so much of the weather we are experiencing right now. Water vapor is the elephant in the room and CO2 is an invisible speck of dust.
BTW we here in the US have had the fifth coldest October and November on record this year. Snow extent in N. America was the highest on record for November. As I write this N. Carolina has forecasts of up to 28″ of snow at the higher elevations. Charlotte, NC to receive 9-11 inches. Raleigh, NC nearer the coast to receive 6-8″. All in all a historic storm that will also effect the southern half of Virginia and a bit of the northern part of S. Carolina.
Non of my comments posted? Must have hit a mark …
[…] https://notrickszone.com/2018/12/08/surprise-co2-warming-signal-absent-in-japan-number-of-cold-days-r… […]