New Study: 3°C Cooling In The Last 200 Years, 7°C Warmer ~7800 Years Ago In France

New Study: 3°C Cooling In The Last 200 Years, 7°C Warmer ~7800 Years Ago In France

A new reconstruction (Martin et al., 2020shows peak mean annual temperatures (14°C) were 7°C warmer than today (7°C, 2009-2017) ~7800 years ago in France. In the last 200 years temperatures have fallen by ~3°C.

Image Source: Martin et al., 2020

Another new study (Caillouet et al., 2019) finds little to no signficant climate changes (temperatures or precipitation) in France since 1873.


Image Source: Caillouet et al., 2019

Critics Face Harsh Climate When It Comes To Expressing Dissent – Especially When It Comes To Science

Tough Times for Critics

By Die kalte Sonne
(Translated by P. Gosselin)

The climate issue now dominates almost all areas of life. This makes it all the more important that the arguments of the critics of the climate alarm are finally heard seriously. Unfortunately, this is not the case.

On the contrary, those who do not support the alarm line will be publicly scolded, possibly obstructing their career and future. An almost perfectly controlled opinion system has been established.

Has something like this existed before? Have there been cases where good arguments were ignored for far too long, where critics had to fear reprisals, to the point where they were finally proved right and public opinion suddenly turned? Yes, there have been such cases. It seems to be a basic psychological pattern in human society to regard one side as the only valid truth in controversial debates and to present competing opinions as the misguided misconceptions of some madmen. The following three examples illustrate this:

1. The case of Claas Relotius

I’m sure you know the case. A Spiegel editor (Claas Relotius), who was highly respected at the time and showered with prizes, had incorporated years of invented facts into his reports. When another reporter (Juan Moreno) found out about his colleague, his superiors did not believe him at first, although he provided good evidence. This went so far that he was threatened with termination of his contract.

Moreno fought for his professional survival and was able to convict Relotius in the end. You can read in Moreno’s exciting book “Thousand Lines of Lies: The Relotius System and German Journalism“.


2. Doping in cycling

For many years, professional doping was used in cycling, and it is probably still the case today. Whoever wanted to make the manipulations public was done in the cycling scene. The best example was the multiple Tour de France winner Lance Armstrong, who defended himself against all accusations legally and otherwise with great effort. In the end, everything was discovered.

In January 2013 Armstrong confessed his doping past in an interview with Oprah Winfrey. Read the book “The Cycling Mafia and its dirty business” by Tyler Hamilton and Daniel Coyle.

3. The rejection of continental drift

Today we know that the continents are moving. When Alfred Wegener proposed this at the beginning of the 20th century, he was laughed at and ridiculed. Long after his death it turned out that he was right. We had reported about it here in the blog (“Plate tectonics is catching on: Lessons for the Climate Debate” and “Continental Shift and Climate Change: The Miraculous Repetition of the History of Science“). A comprehensive treatise on the subject was published by Naomi Oreskes in her book “The Rejection of Continental Drift: Theory and Method in American Earth Science“.

=======================================

4. Alzheimer’s cabal

Another example of rampant dogmatism in science to add here is: “The maddening saga of how an Alzheimer’s ‘cabal’ thwarted progress toward a cure for decades” by Sharon Begley.

Her report exposes how a “cabal” of “influential researchers have long believed so dogmatically in one theory of Alzheimer’s that they systematically thwarted alternative approaches.” Had it not been for this dogmatism, “we would be 10 or 15 years ahead of where we are now,” said Dr. Daniel Alkon, a longtime NIH neuroscientist who started a company to develop an Alzheimer’s treatment.

No Alarm: NASA Data Show Antarctica Temperature Trends Undergoing Nothing Unusual

By Kirye
and Pierre Gosselin

Today we plot NASA Version 4 data for 19 Antarctic stations going back to 1988 (including volcanoes areas of West Antarctica and Peninsula), see map below.

The 19 stations were chosen because they have both Version 3 and Version 4 data available.

We plot the data on 4 different charts for the purpose of clarity. Included are also the volcanic areas of West Antarctica and the West Antarctic Peninsula.

Of the 19 stations plotted, 9 show no warming using NASA GISS Version 4 data. Version 3 the number is 10 not showing any warming. The stations that are cooling/stable are underlined in blue on the map above.

What follows are plots of the first 7 (warmest) stations:

The above chart shows the data for the stations located at the West Antarctic peninsula. The data over the past 30 years show no unusual changes happening.

The next chart depicts 8 additional stations whose mean annual temperature is around -10°C.

Also here we see no unusual activity from the NASA data. Most are cooling a bit, or near stable.

Above Halley shows a cooling trend, while the fragmented data from Mcmurdo Sound show warming, though nothing out of the ordinary.

Finally plots of the 2 remaining (coldest) stations, Amundsen and Vostok, are shown:

As you can see, the incomplete data of these two frigid stations suggest some moderate warming. But at those ranges, even slight atmospheric perturbations can have notable effects on temperature there.

At -49°C and -55°C respectively, they are pretty much stuck at rock bottom and suggest no sign of any unusual warming. For those waiting for signs of global climate change coming out of Antarctica, you might be waiting quite awhile longer.

North Atlantic Sea Levels Have Been Falling At A Rate Of 7.1 mm/yr Since 2004…In Tandem With 2°C Cooling

Rapid cooling in the North Atlantic has reversed regional sea level changes and has apparently spread to the Greenland ice sheet.

Image Source: Chafik et al. (2019)

Despite stressing global sea level rise is worrisome and due to anthropogenic warming, Chafik et al. (2019) report a distinct cooling trend in the North Atlantic that coincides with a transition to falling regional sea levels since 2004.

Image Source: Chafik et al. (2019)

Meanwhile, Ruan et al. (2019) attribute the rapid deceleration in Greenland ice sheet melt since 2013 to the -2.0°C North Atlantic cooling that apparently has begun affecting the Arctic.

Image Source: Ruan et al. (2019)

A cooling trend in recent decades has also spread to West Antarctica, the Antarctic Peninsula, and East Antarctica (Lüning et al.,2019).

Image Source: Lüning et al.,2019

North America as a continent has been cooling since 1998 (Gan et al., 2019), with no significant net change since 1982.

Image Source: Gan et al., 2019

The Southern Ocean – 14% of the Earth’s surface – has been been cooling since 1979 (Zhang et al., 2019).

Image Source: Zhang et al., 2019

Large regions of the Northern Hemisphere – especially in Asia –  have been cooling since 1990 (Kretschmer et al., 2018).

Image Source: Kretschmer et al., 2018

Other than these regions, the entire globe has been warming…in line with what would be expected with global warming.

German “Speech Police” Announce 2019’s Defamatory Word Of The Year: “Climate Hysteria”!

That’s right, last week a panel, made up of 4 pompous linguists and one journalist, chose “climate hysteria” as Germany’s taboo word (un-word) of 2019.

Image: PatriotRetort.com

Discriminatory, disguising or misleading

The Unwort des Jahres (un-word of the year) is a new or recently popularized term used in Germany which a panel deems “violates human rights or infringes upon Democratic principles”.

According to Wikipedia, “The term may be one that discriminates against societal groups or may be euphemistic, disguising or misleading. The term is usually, but not always, a German term. The term is chosen from suggestions sent in by the public.”

Over the years, like so many other institutions, the volunteer panel has leaned to the left and has been choosing words that tend to cast conservatives and the right political spectra in a negative light. The panel’s announcement of the un-word of the year gets broad media coverage.

Last week the panel selected “climate hysteria” as the un-word of the year.

Taboo because it “defames climate protection efforts”

According to Wikipedia, the panel – which has no scientific expert on it at all, chose “climate (change) hysteria” as the un-word of 2019 because it “defames climate protection efforts and the climate protection movement, and discredits important discussions about climate protection.”

Climate science dissent is no longer welcome, the panel wants to tell us.

According to Wikipedia:

The expression [climate hysteria] was used by many in politics, economics, and the media in 2019 – by the Frankfurter Allgemeine Zeitung as well as by entrepreneurs and especially by politicians of the Alternative for Germany party. It dismisses the increased commitment to climate protection as some kind of collective psychosis. Moreover, in light of scientific findings regarding climate change, this word is misleading and irresponsibly supports anti-scientific tendencies.”

Yet, thankfully, some media have grown critical of the panel of volunteer linguists and single journalist, and all the media attention it gets. For example, Bild newspaper wrote:

As if it were the decision of an important institution, the decision of a privately organised group is reported: Four linguists and a journalist who volunteer once a year to play linguistic police. According to the motto: Listen up, citizens, the language committee has decided, this word is taboo from now on!

Ironically, in 2011 the panel chose “alternativlos” (no alternative) as the un-word of 2010 in politics because they claimed it was “undemocratic”, as any discussion on a subject “would be deemed unnecessary or undesirable”.

Today the panel appears to have forgotten about that earlier choice.

In any case, skeptics and dissenters should instead ramp up the use of the term “climate hysteria” to describe the FFF and XR movements, and all the nutty doomsday scientists who like telling us there’s no alternative to decarbonization.

Bike Riding May Be Gentle On Climate, But Remains Extremely Dangerous To Health And Life!

Not long ago one (right wing) politician warned before the German Parliament that the bicycle as a means of transport was extremely dangerous – especially for children – and thus ought not be promoted.

“Highly impractical and dangerous”

This of course brought ridicule from the infallible leftists and greens – and yes, even from German centrists who have long become all drugged up on green and “climate protection”.

AfD parliamentarian Dr. Dirk Spaniel told before the Parliament: “Soberly considered, bicycles are highly impractical and dangerous.”

According to Spaniel, a transportation expert, a child transported on a bicycle is exposed to greater danger than in a car. On the Green Party’s vision of a bicycle utopia in Germany and the world, Spaniel mocked: “They want to draw an ideal fairy tale world here with bicycles, which do not exist in this form.”

Twice as likely to die on a bike

As much as the left and greens like to ridicule Dr. Spaniel’s claim, it is backed up by most studies.

For example, the Washington Post here writes that “bikes are the most dangerous way to get around with the exception of motorcycles” and that in the USA, “you’re more than twice as likely to die while riding a bike than riding in a car, per trip” and riding a bicycle is “about 500 times more fatal than riding in a bus”. Here the WaPo cited according a 2007 study led by Centers for Disease Control and Prevention epidemiologist Laurie Beck.

Why so many German politicians are now striving to transport children using such a dangerous mode of transport remains a mystery. It’s one of the side effects of being drugged on green. In their doped minds, addicts dismiss all the risks and amplify the promised benefits.

Bicycle deaths rising in Germany

As bike riding increases in Germany, so do the accidents and fatalities. According to Spiegel, citing the Federal Statistical Office in Wiesbaden: “445 people died in accidents on a bicycle – 63 cyclists more than in the previous year and the highest number since 2009.”

“A total of 88,850 cyclists were involved in accidents on German roads in 2018,” Spiegel wrote earlier in 2019.  “That is around 11 percent more than in the previous year.”

25 times higher risk of injury

According to AfD Parliamentarian Dr. Dirk Spaniel: “Parents who transport their children on bicycles increase the risk of injury to them 25 times more than those who transport them by car.”

Time for parents to be responsible for their kids and to stop pretending they can be responsible for the climate.

Ireland Temperatures Cooling Since 1988. And Deep Blue Vermont Says ‘No’ To Wind Power

By Kirye
and P. Gosselin

Yes, climate change is real.

But what they don’t tell us is that in many places that change has gone in the opposite direction of what alarmists like to have us think.

Moreover, that change is obviously driven far more by natural causes, such as solar and oceanic cycles, and has very little to do with man-made CO2.

Today we look at the untampered temperature datasets of the Japan Meteorological Agency (JMA) that go back to 1988 and which are mostly complete.

Here’s the plot of the 6 stations with adequate data:

Data: JMA

Five of the 6 stations show cooling or no upward trend. Earlier predictions of rapid warming are proving to be false.

Next is a plot of 8 stations using data from NASA, which show notable cooling trend over the past 25 years:

Deep blue Vermont says no to Big Wind

When it comes to wind energy, we’re seeing strong signals against it coming from Vermont, a state that is as politically blue, and thus pro-green, as any state could possibly be.

One would think that the Green Mountain State would welcome “clean”, renewable wind energy and happily make its contribution to rescuing the climate and environment. Vermont, after all, is home to Bernie Sanders and Bill McKibben.

Ironically, Vermont’s strong environmental streak is backfiring on industrial wind. Vermont citizens are realizing industrial wind parks are not green after all, and aren’t worth defacing the rural landscape. Vermonters now more than ever want them the hell out.

For example, Windpower Engineering Development site here reports how Vermont’s political environment now “is hostile to wind energy”.

“In 2012, there were over a dozen wind projects in development. Now there are none. This is truly a sad state of affairs for Vermont,” stated David Blittersdorf, CEO and founder of AllEarth Renewables.

Large wind facilities banned

Meanwhile voters in the tiny Vermont village of Grafton have endorsed a new town plan that prohibits industrial and commercial wind, reports the Brattleboro Reformer here. “On a 95-66 vote during an all-day ballot Monday, residents approved the new town plan, which bans any large wind facility, and includes other planning updates.”

Also neighboring Windham has said “no” to industrial wind parks by developer Iberdrola, which has since “dropped its plans to build what would have been the largest wind project in the state of Vermont,” writes the Brattleboro Reformer.

Good to see Vermonters are finally waking up to the green energy madness and landscape blight and zero benefit it all leads to.

19 Papers Published In 2019 Affirm Sea Levels Were METERS Higher Than Today 4-8 Thousand Years Ago

The onslaught of paleoclimate evidence for warmer-than-now Mid-Holocene climates – when the Earth’s sea levels were meters higher than they are today –  stormed through 2019.

There were 107 scientific papers published this past year indicating today’s warmth isn’t even close to being unusual or unprecedented when compared to the climates of the last centuries to millennia.

As illustrated below, there were also 19 papers affirming today’s sea levels are among the lowest of the last ~8000 years.

This is added to the list of nearly 100 scientific papers published in the last handful of years indicating Mid-Holocene sea levels were multiple meters higher than they are today due to the much more extensive glacier and ice sheet melt occuring during these millennia.


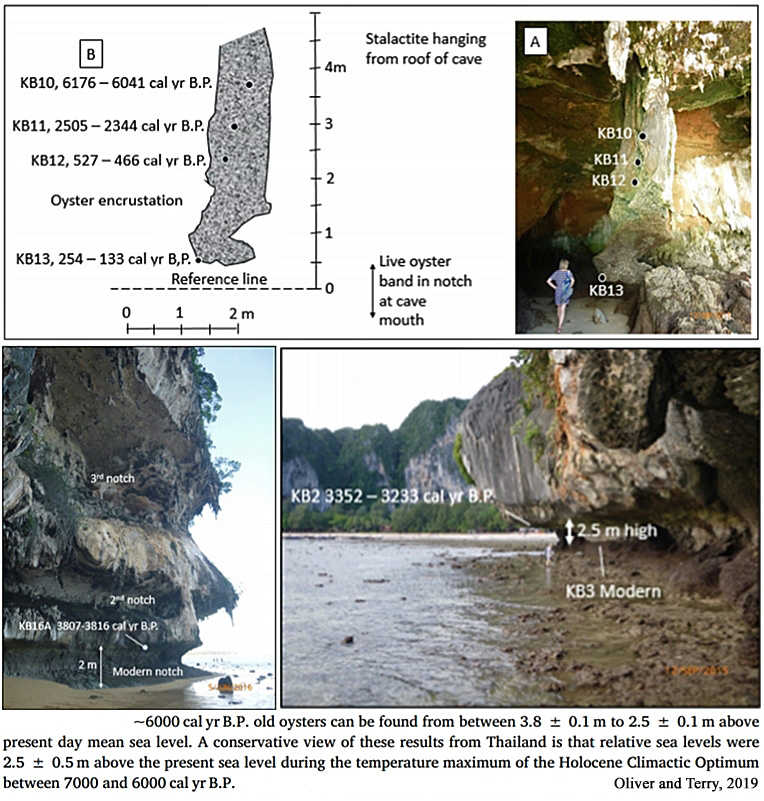
Oliver and Terry, 2019  Thailand, +2.0 to 3.8 m higher than present

~6000 cal yr B.P. old oysters can be found from between 3.8 ± 0.1 m to 2.5 ± 0.1 m above present day mean sea level. … Dead (fossil) oysters were collected from between 1 and 3 m above the centre of the live oyster band in a more sheltered cleft inside the notch. The oldest sample with an age of 5270–4950 cal yr B.P. was collected at an elevation of 3.01 ± 0.1 m above the apex of the notch. The ages decrease with elevation down to 920–710 cal yr B.P. at 1.03 m. … In all the sites, the 14C age of the dead oysters inside the notches increases with increasing elevation above present day MSL. Clearly, relative sea level was 2 to 3 m higher than present between 6000 and 3000 B.P. and has steadily fallen since.”

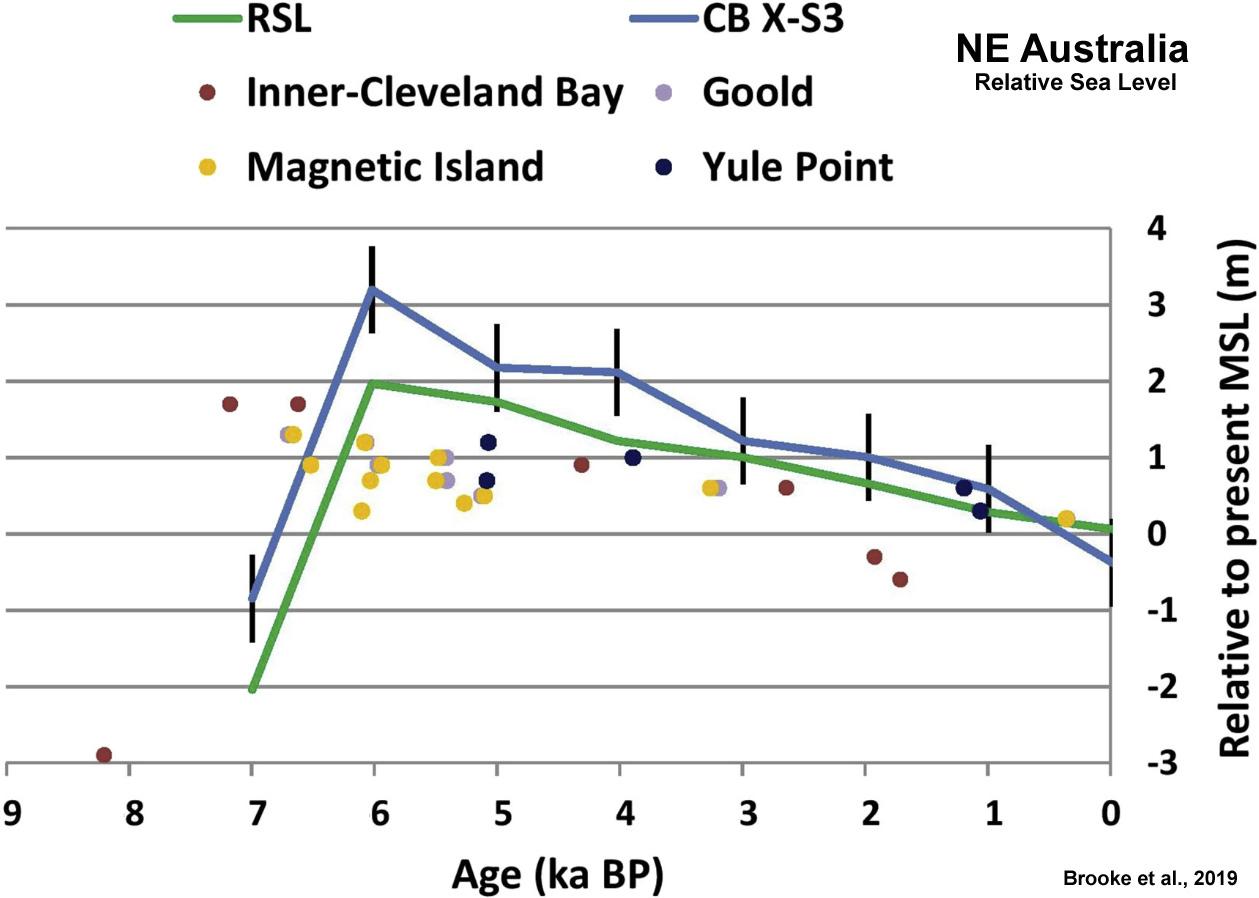
Brooke et al., 2019  Queensland (NE Australia), +1-2 m higher than present

“Indicator data for Queensland have been assessed for their accuracy and robustness by Lambeck et al. (2014), who identified a number of coastal and inner shelf island sites in the northeastern region, in which Cowley Beach is located (Fig. 1), where accurately dated in situ fossil coral, coral microatolls and sediment core samples provide robust sea-level records (Chappell, 1983; Chappell et al., 1983; Horton et al., 2007; Yu and Zhao, 2010; Zwartz, 1995; Fig. 3). Here, relative sea level reached a Holocene highstand between 6770 and 5520 yr BP approximately 1–2 m above the present level (Lewis et al., 2013; Fig. 3). Following the highstand, the data record a gradual fall in sea level to the present position (Perry and Smithers, 2011; Lambeck et al., 2014). … Local and regional records for the Holocene at far-field sites may also reflect the influence of climatic variations on sea level, such as shifts in the El Nino Southern Oscillation (ENSO), that can induce minor (<0.5 m) changes in sea level (Duke et al., 2017; Leonard et al., 2018; Sloss et al., 2018) on annual to multi-decadal, rather than millennial, timescales.”

Yamano et al., 2019 SW Japan, +1.1 to 1.2 m higher than present

“Evidence from the core samples and fossil microatolls suggests sea level reached its present position before 5100 cal yr B.P., and a relative sea-level highstand of 1.1–1.2 m above the present sea level occurred from 5100 to 3600 cal yr B.P. This was followed by a gradual fall in relative sea level. The tectonically corrected sea-level curve indicates a stable sea level after 5100 cal yr BP., with a sea-level highstand of up to 0.4 m between 5100 and 3600 cal yr B.P.”

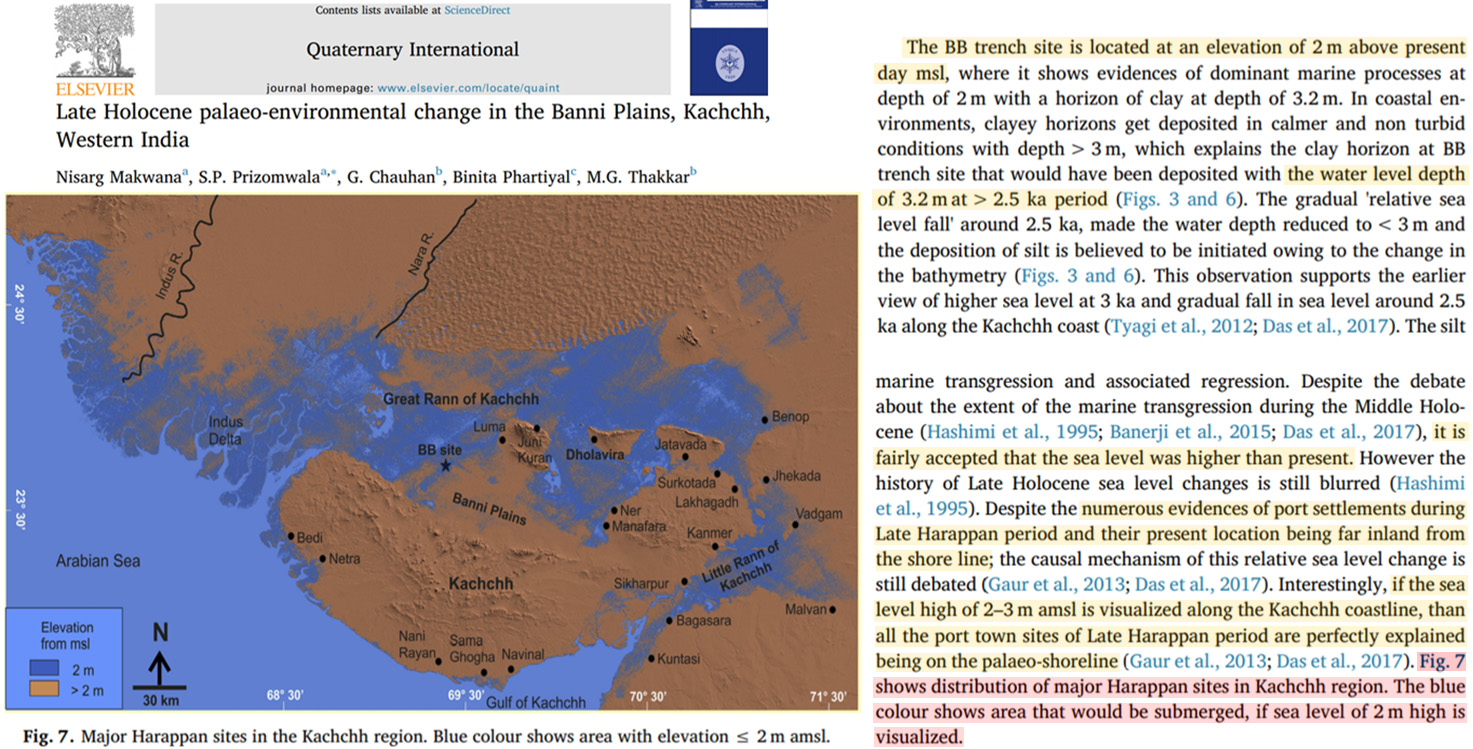
Makwana et al., 2019 Western India, +2 to 3 m higher than present

The BB trench site is located at an elevation of 2 m above present day msl, where it shows evidences of dominant marine processes at depth of 2 m with a horizon of clay at depth of 3.2 m. In coastal environments, clayey horizons get deposited in calmer and non turbid conditions with depth > 3 m, which explains the clay horizon at BB trench site that would have been deposited with the water level depth of 3.2 m at > 2.5 ka period.”

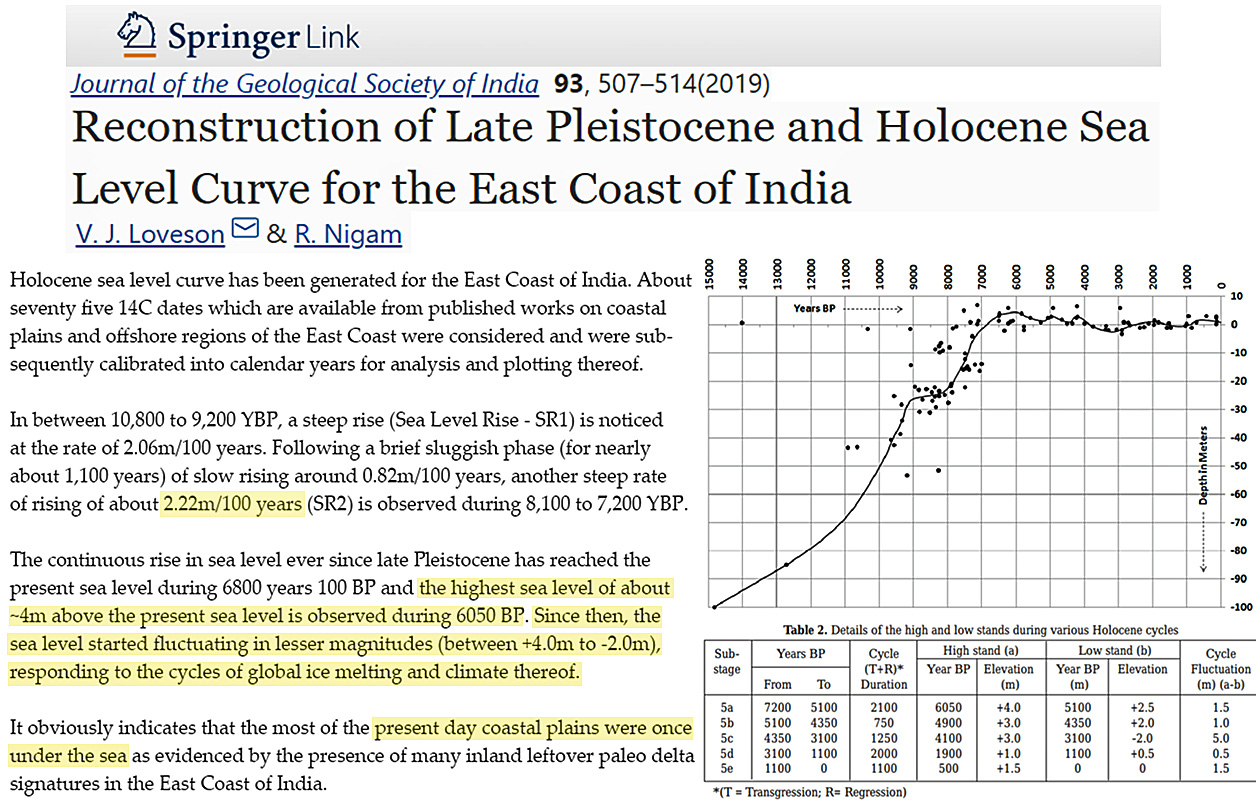
Loveson and Nigam, 2019 Eastern India, +4 m higher than present

“The continuous rise in sea level ever since late Pleistocene has reached the present sea level during 6800 years 100 BP and the highest sea level of about ~4m above the present sea level is observed during 6050 BP. Since then, the sea level started fluctuating in lesser magnitudes (between +4.0m to -2.0m), responding to the cycles of global ice melting and climate thereof. … It is also observed that the magnitude of all five high stands in between 7,200 to the recent has a decreasing trend from +4m to 0m. It obviously indicates that the most of the present day coastal plains were once under the sea as evidenced by the presence of many inland leftover paleo delta signatures in the East Coast of India.”

Oliver et al., 2019  South Australia, +2 m higher than present

“Raised beach strata imaged with Ground Penetrating Radar (GPR) at Rivoli Bay suggest a sea-level highstand of +2 m above present ~3500 years ago, steadily falling and reaching the present ~1000 years ago.”

Kylander et al., 2019  Scotland, +9 m higher than present

“At present, the Laphroaig bog is edged by a dune system, but this sand source may have looked very different at the time peat accumulation started 6670 cal. a BP. A primary control on dune building is RSL. Glacial isostatic modelling, supported by radiocarbon-dated sea-level index points, show that the RSL on Islay was about 9 m higher at 6000 cal. a BP, and fell in a linear fashion to 2.2 m higher than present at 2000–1000 cal. a BP (Fig. 7C;Dawsonet al. 1998; Shennan et al. 2006a,b).”

Meeder and Harlem, 2019  Southeast Florida (USA), +1-1.3 m higher than present

Sea level was at ca 8 m above present during the last interglacial ca 120,000 yr bp inundating the entire platform during deposition of the Miami Limestone strata (Moore, 1982) …  The marls form a leaky seal on the Everglades floor (Figure 14B) slowing water infiltration and storing water, increasing the hydroperiod and providing an environment suitable for peat deposition which started ca 4,500 yr bp (Gleason & Stone, 1994) at elevations between 1 and 1.3 m above present sea level (Wanless et al., 1994). … The historic high‐water stage occurred prior to drainage when the water stage was between 0.6 and 2  m higher than present in the study area (McVoy et al., 2011; Parker, 1975; Parker et al., 1955).”

Cuttler et al., 2019  Western Australia, +1-2 m higher than present

Ningaloo Reef grew over the last ~8,000 years (Twiggs and Collins, 2010) with rapid reef build up ceasing ~5.8 ka BP when sea level was approximately 1 to 2 m higher than present. During this phase of development, benthic cover was dominated by reef-building corals (Collins et al., 2003; Twiggs and Collins, 2010). After this sea level highstand, reef evolution at Ningaloo was characterised as ‘detrital build-up and aggradational’ as sea level fell to present levels and the reef back-stepped (seaward) to its present location (Twiggs and Collins, 2010).”

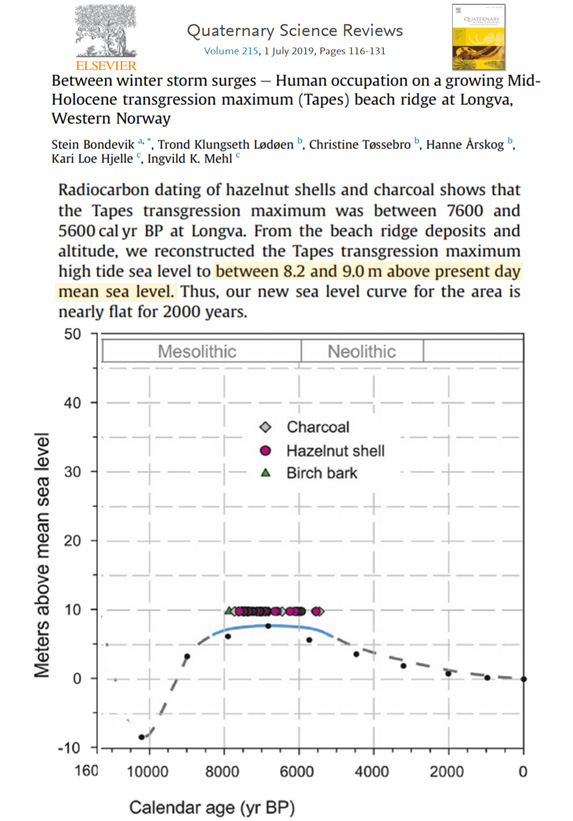
Bondevik et al., 2019 Western Norway, +8.2 to +9 m higher than present

“We conclude that the maximum sea level of the Tapes transgression lasted 2000 years from 7600 cal yr BP and extended into the Early Neolithic, to about 5600 cal yr BP (Fig. 13), with an uncertainty of about 100 years. We estimate that the highest spring tide during the Tapes transgression maximum phase was between 8.2 and 9.0 m above the present mean sea level. … To account for additional uncertainties, we suggest that the spring tide sea level at Longva would have been 8.6 ± 0.4 m above present day mean sea level during the Tapes transgression maximum.”

Yamada et al., 2019   Japan, +1 m higher than present

“Post-glacial sea level reached about 1 m higher than today around 6000 years ago and then started to fall (Yokoyama et al., 1996). As such, a sudden appearance and increase of marine and brackish diatoms just below PL-b cannot be explained by eustatic sea-level change.”

Montaggioni et al., 2019 French Polynesia, +0.8 m higher than present

“The foundations of islets (motus), namely conglomerate platforms, started to form with deposition of patchy, rubble spreads over the upper reef-rim surfaces from ca 4,500 yr BP as sea level was about 0.80 m above its present mean level. On these platforms, islets started to accrete not before ca 2,300 yr BP, from isolated depocentres located midway between outer-reef and lagoon margins. At that time, sea level at about +0.60 m above present mean sea level was starting to slowly decrease to its present position.”

Brouwers et al., 2019  Dubai, +1.6 to 2.5 m higher than present

“During Pleistocene glaciations, global sea level was 100–120 m below the present level and resulted in most of the Arabian Gulf occurring as a dry basin (Purser 1973; Gunatilaka 1986) … Since late Pleistocene to early Holocene times, the sea level rose gradually until a maximum sea level stand 1.6– 2.5 m higher than today (Gunatilaka 1986).”

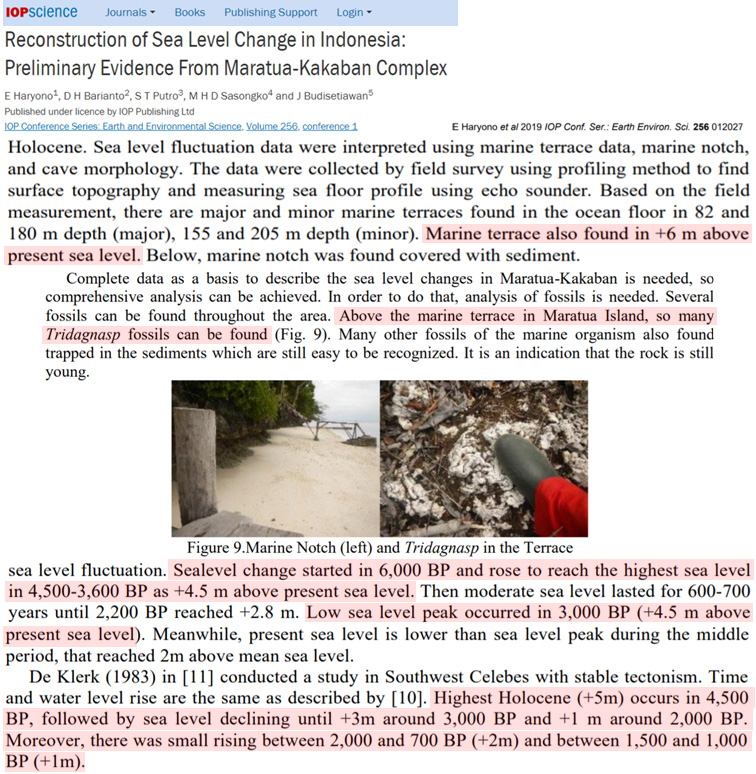
Haryono et al., 2019  Indonesia, +4.5 to 6 m higher than present

[I]n 5000 BP, sea level increases up to +5 m from the present time; it means it was warmer than the present day. … Sealevel change started in 6,000 BP and rose to reach the highest sea level in 4,500-3,600 BP as +4.5 m above present sea level. Then moderate sea level lasted for 600-700 years until 2,200 BP reached +2.8 m. Low sea level peak occurred in 3,000 BP (+4.5 m above present sea level). Meanwhile, present sea level is lower than sea level peak during the middle period, that reached 2m above mean sea level. … Marine terrace also found in +6 m above present sea level.”

Williams et al., 2019 North Vietnam, +2 to 4 m higher than present

A freshwater coastal marsh near the mouth of the Cam River in Northern Vietnam stands 2–3 m above mean sea level and is bordered by a coastal barrier that reaches about 6 m above mean sea level. A core from the marsh contains a 14-cm-thick sand and shell layer. The presence of abundant shell fragments suggests inland transport of littoral sediment, and the sand layer is tentatively identified as a washover deposit. The coast of the study area contains a beachrock standing above the modern beach and reaching to 4 m above mean sea level. A tentative explanation of this beachrock is that it represents a beach that formed during a mid-Holocene 2–3-m highstand, evidence for which has been reported from Thailand, Malaysia, Singapore, and Vietnam.”

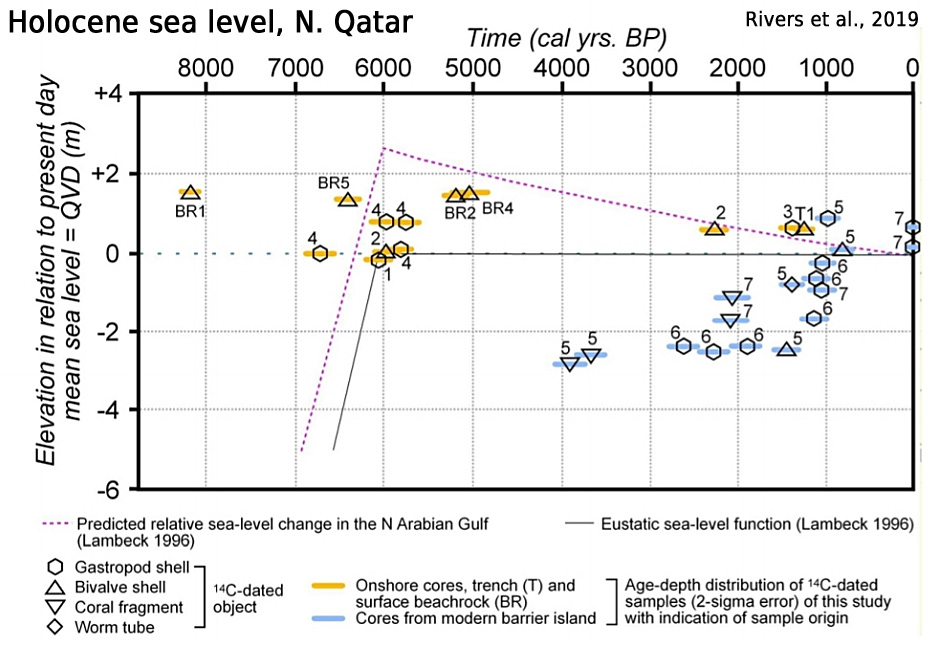
Rivers et al., 2019  Northern Qatar, +1.6 m higher than present

“The Al Ruwais area of northern Qatar has been the site of shallow water carbonate sedimentation since the mid-Holocene. Two distinct depositional packages have been identified. Between ca 7000 and 1400 years ago, when sea-level was up to 1.6 m higher than today, a barrier/back-barrier system was active in an area immediately landward of the modern shoreline. During the same period, a laterally-continuous coral reef flourished in the open waters approximately 3 km to the north. Towards the end of this period sea-level fell to its current position, and the reefal system died, perhaps due to exposure or the influx of detrital sediment. Between 1400 and 800 years ago a new barrier island was established directly on top of the moribund reef, and the old barrier to the south was exposed to the meteoric realm. Over the past ca 800 years the new barrier has retreated landward as much as 1 km to its current position.”

Fachbereich, 2019  Antarctic Peninsula, +14.5 to 16 m higher than present

Raised beaches along the coasts of Maxwell Bay, located at 7.5 to 4 m amsl (locally termed “6-m-beaches”), interfinger with terminal moraines of the last glacial-readvance (LGR), which occurred between 0.45 and 0.25 ka cal BP (John and Sugden, 1971; Sugden and John, 1973; Clapperton and Sugden, 1988; Yoon et al., 2004; Yoo et al., 2009; Simms et al., 2012). It is therefore likely that these beaches developed during the LGR (John and Sugden, 1971; Sugden and John, 1973; Hall 2010). Recent uplift of KGI was 0.4 mm a-1 during the last decade (Rülke et al., 2015). Average uplift during the entire Holocene, however, is 2.8 to 3 mm a-1 (Bentley et al., 2005; Fretwell et al., 2010). Fall of relative sea level on KGI accelerated during the last 500 years (Bentley et al., 2005, Hall, 2010; Watcham et al., 2011). This was most likely the result of a short-term acceleration in glacio-isostatic rebound after the LGR, with a modeled peak uplift rate of 12.5 mm a-1 between 1700 and 1840 CE (Simms et al., 2012). …  Bentley et al. (2005) show that an initial post-glacial sea-level fall was interrupted by a mid-Holocene highstand at about 14.5 to 16 m amsl from 5.8 to 3.0 ka cal BP. In contrast, data presented by Hall (2010) show a continuous sealevel fall, which becomes accelerated between 1.5 and 0.5 ka cal BP.”

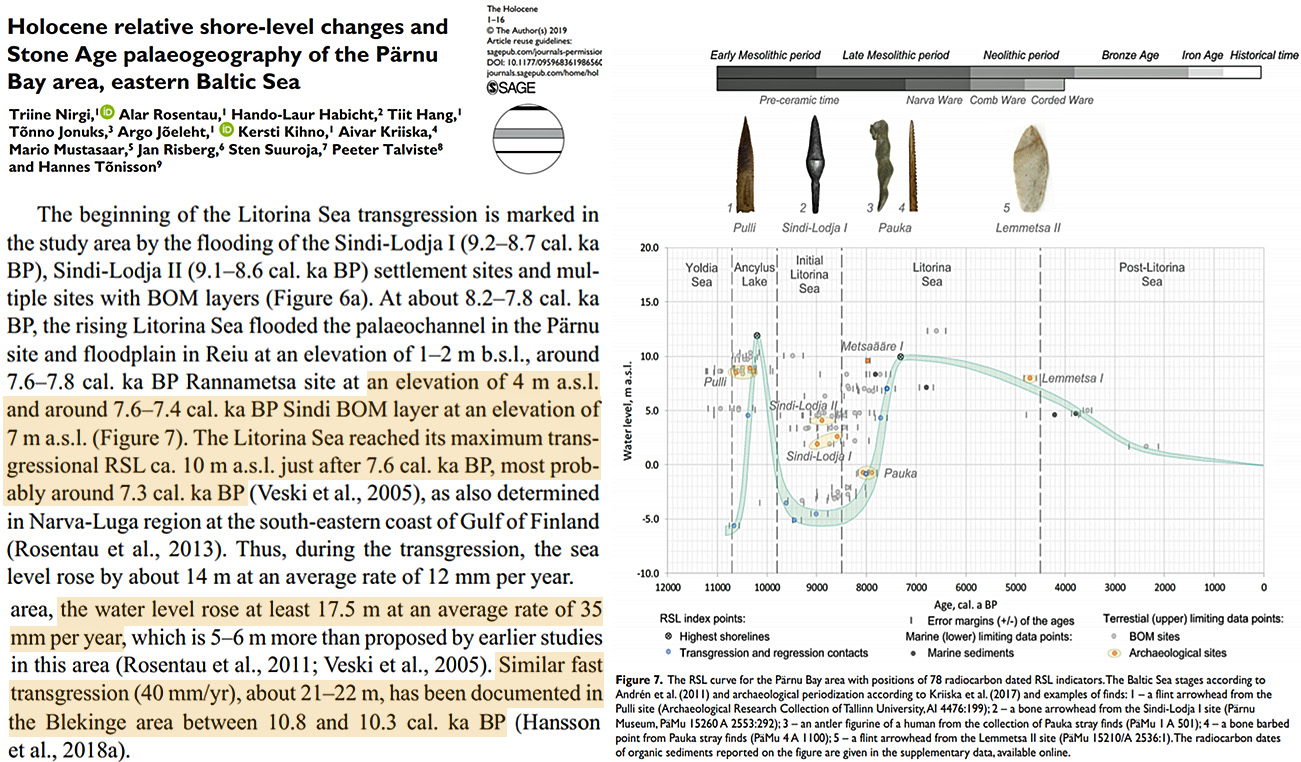
Nirgi et al., 2019  Baltic Sea, +10 m higher than present (rate: +3.5 meters per century)

“Considering the elevations of the pre-Ancylus Lake palaeochannel sediments in the Pärnu site and the highest coastal landforms in the area, the water level rose at least 17.5 m at an average rate of 35 mm per year, which is 5–6 m more than proposed by earlier studies in this area (Rosentau et al., 2011; Veski et al., 2005). Similar fast transgression (40 mm/yr), about 21–22 m, has been documented inthe Blekinge area between 10.8 and 10.3 cal. ka BP (Hansson et al., 2018a). … At about 8.2–7.8 cal. Ka BP, the rising Litorina Sea flooded the palaeochannel in the Pärnu site and floodplain in Reiu at an elevation of 1–2 m b.s.l., around 7.6–7.8 cal. ka BP Rannametsa site at an elevation of 4 m a.s.l. and around 7.6–7.4 cal. ka BP Sindi BOM layer at an elevation of 7 m a.s.l. (Figure 7). The Litorina Sea reached its maximum transgressional RSL ca. 10 m a.s.l. [meters above present sea level] just after 7.6 cal. ka BP, most probably around 7.3 cal. ka BP (Veski et al., 2005), as also determined in Narva-Luga region at the south-eastern coast of Gulf of Finland (Rosentau et al., 2013). Thus, during the transgression, the sea level rose by about 14 m at an average rate of 12 mm per year.”

Rasmussen et al., 2019  Denmark, +3 m higher than present

“Full marine phase (c. 7700–3700 cal. a BP). – The appearance of a high salinity demanding fauna in this phase (several mollusc species, echinoids and Quinqueloculina seminulum) indicates a change to full marine conditions (Figs 4, 11). This marked environmental change coincides with a rapid and significant sea-level rise documented in both the Danish and the Baltic area dated to around 7600 cal. a BP (Fig. 11; Morner 1969; Christensen 1995, 1997; Yu et al. 2007; Lampe et al. 2011; Sander et al. 2015) and probably of global extent related to the so-called ‘global meltwater pulse 3’ documented in Caribbean-Atlantic coral sea-level records c. 7600 cal. a BP (Blanchon & Shaw 1995; Blanchon et al. 2002; Bird et al. 2010; Blanchon 2011a,b). Based on data from a recent study on the island of Samsø in the central Kattegat, Sander et al. (2015) estimated a relative sea-level rise of ~4.5 m between 7600 and 7200 cal. a BP. A high sea level in Aarhus Bay at this stage is supported by an almost complete absence of terrestrial plant macrofossils (Fig. 5) testifying to an increased distance between the core site and the shore. … In the period of greatly increased sedimentation (c. 7700–6300 cal. a BP), the average rate is ~2.8 mm a1 (Fig. 11). The extensive coastal erosion during this sea-level highstand period is manifested in today’s landscape in the form of numerous fossil coastal cliffs situated above present-day sea level that formed during the Mid-Holocene when the relative sea level was ~3 m higher than present along the coasts of the Aarhus Bay area (Mertz 1924). … In a study of the island of Anholt in the central part of the Kattegat, the drop in absolute sea level was estimated to 2.6 m over a 700-year period between 4300 and 3600 cal. a BP (with most of the sea-level fall taking place between 4250 and 3740 cal. aBP; Clemmensenet al. 2012).”

Fizzling FFF! ARD Trends: Only 27% Of Germans Regard Climate Protection As A Political Priority

At his German news commentary site, Gabor Steingart reports on the results of the latest ARD German public broadcasting trend analyses. Here it’s clear that German citizens are speaking loud and clear on the topic of climate protection: not so fast!

Rush to Green Deal without support

Lately the media and politicians have been pushing hard to start a fundamental change of society to a low-carb, de-industrialized organic garden society. For example, EU Commission President Ursula von der Leyen just announced a 1 TRILLION euro plan to decarbonate the continent.

Yet, public support for such an ambitious and adventurous transformation project appears to be rather soft at best in Germany.

According to Steingart:

Only 27 percent of Germans regard climate protection as a political priority. 73 percent have other concerns. Outside of the green voters (currently 23 percent in surveys), the alarmism of politicians (“climate emergency”) and scientists (“ecocide”) meets with discontent. The people want to say to the grand coalition government: Don’t throw the baby out with the bath.”

Greenland sets new record low

On another note, according to the Austrian www.wetter.at site, Greenland recorded a new all time record low temperature. The site reports:

While 2019 is the warmest year in Australia since records began, as the Office of Meteorology stated in its annual climate report, Greenland has set a new record for cold temperatures: minus 66 degrees C.”

Mother Nature tricks Europe

Meanwhile, parts of central Europe have been experiencing record warm January temperatures, and thus reinforce the collective public’s impression that the global climate is out of whack. It’s not.

How unfortunate that Mother Nature would play such a mean trick on Europe. Everywhere else it’s pretty much winter as usual:

Image: Ventusky, via Pure Climate Skeptic

Now European policymakers are going to have an easier time getting the public to accept the EU “Green Deal”. Boy, are they in for a cold awakening.

Comprehensive Data, Recent Studies In Top Journals: Antarctica Stable, Temps Falling, Ice Mass Growing!

News from Antarctica: how’s the ice?

By
(German text translated/edited by P. Gosselin)

The ice in Antarctica, how is it doing? Is it melting, is it growing? In the following we wishto present the latest literature on the subject. There is a lot to report.

Fasten your seat belt, there’s a lot to cover.

Let’s start with the temperature development because along with snowfall, this is the most important control factor for Antarctic inland ice.

At NoTricksZone, Kirye shows ten coastal stations of Antarctica. None have been warming over the past 10 years. An example followws

And here’s the temperature development of the entire Antarctic according to UAH and RSS satellite measurements (from Climate4You, via NoTricksZone):

According to Clem et al. 2018, East Antarctica has cooled over the last 60 years, while West Antarctica has warmed. The authors establish a connection with the SAM ocean cycle, the Southern Annular Mode. Euan Mearns also deals with the temperature development of Antarctica during the last decades.

Increased ice

Based on height and gravity field measurements by satellite and GPS measurements on the ground, Martin-Español et al. 2017 determined an increase in ice mass in the East Antarctic and a reduction in ice mass in the (much smaller) West Antarctic for the interval 2003-2013. NASA researcher Jay Zwally also interprets an increase in the East Antarctic ice mass. However, a paper announced in mid-2018 still seems to be stuck in review…

Will the ice of East Antarctica be dragged along by the melting West Antarctic at some point in the melting vortex? No, this will not happen, Indiana University said in a press release of 2017:

New study validates East Antarctic ice sheet should remain stable even if western ice sheet melts

A new study from Indiana University-Purdue University Indianapolis validates that the central core of the East Antarctic ice sheet should remain stable even if the West Antarctic ice sheet melts. The study’s findings are significant, given that some predict the West Antarctic ice sheet could melt quickly due to global warming.

If the East Antarctic ice sheet, which is 10 times larger than the western ice sheet, melted completely, it would cause sea levels worldwide to rise almost 200 feet, according to Kathy Licht, an associate professor in the Department of Earth Sciences in the School of Science at IUPUI. Licht led a research team into the Transarctic Mountains in search of physical evidence that would verify whether a long-standing idea was still true: The East Antarctic ice sheet is stable.

The East Antarctic ice sheet has long been considered relatively stable because most of the ice sheet was thought to rest on bedrock above sea level, making it less susceptible to changes in climate. However, recent studies show widespread water beneath it and higher melt potential from impinging ocean water. The West Antarctic ice sheet is a marine-based ice sheet that is mostly grounded below sea level, which makes it much more susceptible to changes in sea level and variations in ocean temperature. „Some people have recently found that the East Antarctic ice sheet isn’t as stable as once thought, particularly near some parts of the coast,“ Licht said.

Recent studies have determined that the perimeter of the East Antarctic ice sheet is potentially more sensitive and that the ice may have retreated and advanced much more dynamically than was thought, Licht said. „We believed this was a good time to look to the interior of the ice sheet. We didn’t really know what had happened there,“ Licht said. The research team found the evidence confirming the stability of the East Antarctic ice sheet at an altitude of 6,200 feet, about 400 miles from the South Pole at the edge of what’s called the polar plateau, a flat, high surface of the ice sheet covering much of East Antarctica.

To understand how an ice sheet changes through time, a continuous historical record of those changes is needed, according to Licht. The team found layers of sediment and rocks that built up over time, recording the flow of the ice sheet and reflecting climate change. Finding that record was a challenge because glaciers moving on land tend to wipe out and cover up previous movements of the glacier, Licht said.

The big question the team wanted to answer was how sensitive the East Antarctic sheet might be to climate change. „There are models that predict that the interior of the East Antarctic ice sheet wouldn’t change very much, even if the West Antarctic ice sheet was taken away,“ Licht said. According to these models, even if the ice sheet’s perimeter retreats, its core remains stable. „It turns out that our data supports those models,“ she said. „It’s nice to have that validation.“

The team’s research findings are presented in a paper, “Middle to Late Pleistocene stability of the central East Antarctic Ice Sheet at the head of Law Glacier,” that was published today online in the journal Geology.  The research presented is in collaboration with Mike Kaplan, Gisela Winckler, Joerg Schaefer and Roseanne Schwartz at Lamont-Doherty Earth Observatory in New York.”

A Nature Editorial also dealt with the current growth of the East Antarctic ice in January 2018. Of course, the ice in this region has also been worse at times, so it continues to heat up. However, one would have to go back to the warm Pliocene (5.3-2.6 million years before today):

A history of instability

The East Antarctic ice sheet may be gaining mass in the current, warming climate. The palaeoclimate record shows, however, that it has retreated during previous episodes of prolonged warmth.

The phrase “at a glacial pace” once invoked a sense of slow and unchangeable movement, an almost imperceptible motion. But decades of remote sensing and seafloor observations have shown that glaciers and ice sheets can respond to disturbances much more dynamically than once thought. But as satellites captured the surges and retreat of Greenland’s maritime glaciers in the past decades the Antarctic ice sheets — east and west of the Trans-Antarctic mountains — were at least assumed to be stable. But this, too, turned out to be wrong. First came sediment1 and model2 evidence that the West Antarctic ice sheet collapsed during previous interglacial periods and under Pliocene warmth. Then came erosional data showing that several regions of the East Antarctic ice sheet also retreated and advanced throughout the Pliocene3. An extended record4 of ice-sheet extent from elsewhere on the East Antarctic coast now paints a more complicated picture of the sensitivity of this ice sheet to warming.”

Curiously enough, half a year later, the tide turned when a paper by Shakun et al. 2018, also in Nature, saw no major problems for the Antarctic ice in the Pliocene:

Minimal East Antarctic Ice Sheet retreat onto land during the past eight million years

The East Antarctic Ice Sheet (EAIS) is the largest potential contributor to sea-level rise. However, efforts to predict the future evolution of the EAIS are hindered by uncertainty in how it responded to past warm periods, for example, during the Pliocene epoch (5.3 to 2.6 million years ago), when atmospheric carbon dioxide concentrations were last higher than 400 parts per million. Geological evidence indicates that some marine-based portions of the EAIS and the West Antarctic Ice Sheet retreated during parts of the Pliocene1,2, but it remains unclear whether ice grounded above sea level also experienced retreat. This uncertainty persists because global sea-level estimates for the Pliocene have large uncertainties and cannot be used to rule out substantial terrestrial ice loss3, and also because direct geological evidence bearing on past ice retreat on land is lacking. Here we show that land-based sectors of the EAIS that drain into the Ross Sea have been stable throughout the past eight million years. We base this conclusion on the extremely low concentrations of cosmogenic 10Be and 26Al isotopes found in quartz sand extracted from a land-proximal marine sediment core. This sediment had been eroded from the continent, and its low levels of cosmogenic nuclides indicate that it experienced only minimal exposure to cosmic radiation, suggesting that the sediment source regions were covered in ice. These findings indicate that atmospheric warming during the past eight million years was insufficient to cause widespread or long-lasting meltback of the EAIS margin onto land. We suggest that variations in Antarctic ice volume in response to the range of global temperatures experienced over this period—up to 2–3 degrees Celsius above preindustrial temperatures4, corresponding to future scenarios involving carbon dioxide concentrations of between 400 and 500 parts per million—were instead driven mostly by the retreat of marine ice margins, in agreement with the latest models5,6.”

Also read more at cato.org.

Antarctica stable

Eight million years ago, the earth’s atmosphere had a similar CO2 content as today. Investigations now show that the Antarctic ice sheet had hardly retreated at that time. The ice is apparently more stable than expected. Click here for the press release from the National Science Foundation. You can also read an article in Popular Mechanics.

University of Edinburgh press release from 2017::

Central parts of Antarctica’s ice sheet have been stable for millions of years, from a time when conditions were considerably warmer than now, research suggests.

The study of mountains in West Antarctica will help scientists improve their predictions of how the region might respond to continuing climate change. Its findings could also show how ice loss might contribute to sea level rise.

Although the discovery demonstrates the long-term stability of some parts of Antarctica’s ice sheet, scientists remain concerned that ice at its coastline is vulnerable to rising temperatures. Researchers from the Universities of Edinburgh and Northumbria studied rocks on slopes of the Ellsworth Mountains, whose peaks protrude through the ice sheet. By mapping and analysing surface rocks — including measuring their exposure to cosmic rays — researchers calculated that the mountains have been shaped by an ice sheet over a million-year period, beginning in a climate some 20C warmer than at present.

The last time such climates existed in the mountains of Antarctica was 14 million years ago when vegetation grew in the mountains and beetles thrived. Antarctica’s climate at the time would be similar to that of modern day Patagonia or Greenland. This time marked the start of a period of cooling and the growth of a large ice sheet that extended offshore around the Antarctic continent. Glaciers have subsequently cut deep into the landscape, leaving a high-tide mark — known as a trimline — in the exposed peaks of the Ellsworth range.

The extended ice sheet cooled the oceans and atmosphere, helping form the world of today, researchers say. Their study is among the first to find evidence for this period in West Antarctica. The research, published in Earth and Planetary Science Letters, was done in collaboration with the Scottish Universities Environmental Research Centre. It was funded by the UK Natural Environment Research Council and supported by British Antarctic Survey.

Professor David Sugden, of the University of Edinburgh’s School of GeoSciences, said: „These findings help us understand how the Antarctic Ice Sheet has evolved, and to fine-tune our models and predict its future. The preservation of old rock surfaces is testimony to the stability of at least the central parts of the Antarctic Ice Sheet — but we are still very concerned over other parts of Antarctica amid climate change.“

As the ice in West Antarctica melts, it rises isostatically, which in turn stabilizes the overlying ice, found a research team from Denmark and Colorado.

Again and again there are the climate stories about the Totten Glacier in the East-Arctic Wilkesland. Gwyther et al. 2018 was able to show that the basal melting of the glacier is subject to strong natural fluctuations (press release of the NSIDC here). There is no long-term melting trend.

Melting from volcanoes

Glaciers in the western Ross Sea are also stable (Fountain et al. 2017, press release here). The rapidly melting Pine Island Glacier in West Antarctica has a hot secret that has now been revealed: Beneath the glacier lies a previously unknown volcanic heat source. University of Rhode Island press release from June 2018 (via EurekAlert!):

Researchers discover volcanic heat source under glacier

Plays critical role in movement, melting

A researcher from the University of Rhode Island’s Graduate School of Oceanography and five other scientists have discovered an active volcanic heat source beneath the Pine Island Glacier in Antarctica. The discovery and other findings, which are critical to understanding the stability of the West Antarctic Ice Sheet, of which the Pine Island Glacier is a part, are published in the paper, „Evidence of an active volcanic heat source beneath the Pine Island Glacier,“ in the latest edition of Nature Communications.

Assistant Professor Brice Loose of Newport, a chemical oceanographer at GSO and the lead author, said the paper is based on research conducted during a major expedition in 2014 to Antarctica led by scientists from the United Kingdom. They worked aboard an icebreaker, the RRS James Clark Ross, from January to March, Antarctica’s summer. „We were looking to better understand the role of the ocean in melting the ice shelf,“ Loose said. „I was sampling the water for five different noble gases, including helium and xenon. I use these noble gases to trace ice melt as well as heat transport. Helium-3, the gas that indicates volcanism, is one of the suite of gases that we obtain from this tracing method. „We weren’t looking for volcanism, we were using these gases to trace other actions,“ he said. „When we first started seeing high concentrations of helium-3, we thought we had a cluster of bad or suspicious data.“

The West Antarctic Ice Sheet lies atop a major volcanic rift system, but there had been no evidence of current magmatic activity, the URI scientist said. The last such activity was 2,200 years ago, Loose said. And while volcanic heat can be traced to dormant volcanoes, what the scientists found at Pine Island was new. In the paper, Loose said that the volcanic rift system makes it difficult to measure heat flow to the West Antarctic Ice Sheet. „You can’t directly measure normal indicators of volcanism — heat and smoke — because the volcanic rift is below many kilometers of ice,“ Loose said

But as the team conducted its research, it found high quantities of an isotope of helium, which comes almost exclusively from mantle, Loose said. „When you find helium-3, it’s like a fingerprint for volcanism. We found that it is relatively abundant in the seawater at the Pine Island shelf. „The volcanic heat sources were found beneath the fastest moving and the fastest melting glacier in Antarctica, the Pine Island Glacier,“ Loose said. „It is losing mass the fastest.“ He said the amount of ice sliding into the ocean is measured in gigatons. A gigaton equals 1 billion metric tons.

However, Loose cautions, this does not imply that volcanism is the major source of mass loss from Pine Island. On the contrary, „there are several decades of research documenting the heat from ocean currents is destabilizing Pine Island Glacier, which in turn appears to be related to a change in the climatological winds around Antarctica,“ Loose said. Instead, this evidence of volcanism is a new factor to consider when monitoring the stability of the ice sheet.

The scientists report in the paper that „helium isotope and noble gas measurements provide geochemical evidence of sub-glacial meltwater production that is subsequently transported to the cavity of the Pine Island Ice Shelf.“ They say that heat energy released by the volcanoes and hydrothermal vents suggests that the heat source beneath Pine Island is about 25 times greater than the bulk of heat flux from an individual dormant volcano.

Professor Karen Heywood, from the University of East Anglia in Norwich, the United Kingdom, and chief scientist for the expedition, said: ‘The discovery of volcanoes beneath the Antarctic ice sheet means that there is an additional source of heat to melt the ice, lubricate its passage toward the sea, and add to the melting from warm ocean waters. It will be important to include this in our efforts to estimate whether the Antarctic ice sheet might become unstable and further increase sea level rise.’

Does that mean that global climate change is not a factor in the stability of the Pine Island Glacier? No, said Loose. ‘Climate change is causing the bulk of glacial melt that we observe, and this newly discovered source of heat is having an as-yet undetermined effect, because we do not know how this heat is distributed beneath the ice sheet.’

He said other studies have shown that melting caused by climate change is reducing the size and weight of the glacier, which reduces the pressure on the mantle, allowing greater heat from the volcanic source to escape and then warm the ocean water. ‘Predicting the rate of sea level rise is going to be a key role for science over the next 100 years, and we are doing that. We are monitoring and modeling these glaciers,’ Loose said.

The scientists conclude by writing: ‘The magnitude and the variations in the rate of the volcanic heat supplied to the Pine Island Glacier, either by internal magma migration, or by an increase in volcanism as a consequence of ice sheet thinning, may impact the future dynamics of the Pine Island Glacier, during the contemporary period of climate-driven glacial retreat.’

In addition to Heywood, Loose worked with Alberto C. Naveira Garabato, of the National Oceanography Centre at the University of Southampton, United Kingdom; Peter Schlosser of Arizona State University’s School of Earth and Space Exploration and the Lamont-Doherty Earth Observatory at Columbia University; William Jenkins of the Woods Hole Oceanographic Institution in Massachusetts; and David Vaughn of the British Antarctic Survey, Cambridge, United Kingdom.”

University of California in Santa Cruz 2015:

Study finds surprisingly high geothermal heating beneath West Antarctic Ice Sheet

UC Santa Cruz team reports first direct measurement of heat flow from deep within the Earth to the bottom of the West Antarctic ice sheet

Read more here.

Article at Spiegel.de 2017:

Researchers discover 91 volcanoes under the ice 

Surprise in Antarctica: hidden under kilometres of ice, researchers have found dozens of previously unknown volcanoes. Eruptions threaten a strong melt – sea levels could rise.”

Read more at Spiegel.de (press release from the University of Edinburgh here).

The West Antarctic Kamb Ice Stream has always puzzled the researchers because here the ice thickened, in contrast to the general melting trend in West Antarctica. What could be the cause? Another volcano, as reported by the University of Washington in 2018: University of Washington 2018:

Volcano under ice sheet suggests thickening of West Antarctic ice is short-term

A region of West Antarctica is behaving differently from most of the continent’s ice: A large patch of ice there is thickening, unlike other parts of West Antarctica that are losing ice. Whether this thickening trend will continue affects the overall amount that melting or collapsing glaciers could raise the level of the world’s oceans.

A study led by the University of Washington has discovered a new clue to this region’s behavior: A volcano under the ice sheet has left an almost 6,000-year record of the glacier’s motion. The track hidden in the middle of the ice sheet suggests that the current thickening is just a short-term feature that may not affect the glacier over the long term. It also suggests that similar clues to the past may be hiding deep inside the ice sheet itself. ‘What’s exciting about this study is that we show how the structure of the ice sheet acts as a powerful record of what has happened in the past,’ said Nicholas Holschuh, a UW postdoctoral researcher in Earth and space sciences. He is first author of the paper published Sept. 4 in The Cryosphere.

The data come from the ice above Mount Resnik, a 1.6-kilometer (mile-high) inactive volcano that currently sits under 300 meters (0.19 miles) of ice. The volcano lies just upstream of the thickening Kamb Ice Stream, part of a dynamic coastal region of ice that drains into Antarctica’s Ross Sea. Studies show Kamb Ice Stream has flowed quickly in the past but stalled more than a century ago, leaving the region’s ice to drain via the four other major ice streams, a switch that glaciologists think happens every few hundred years. Meanwhile the ice inland of Kamb Ice Stream is beginning to bulge, and it is unclear what will happen next. ‘The shutdown of Kamb Ice Stream started long before the satellite era,’ Holschuh said. ‘We need some longer-term indicators for its behavior to understand how important this shutdown is for the future of the region’s ice.’

The paper analyzes two radar surveys of the area’s ice. One was collected in 2002 by co-authors Robert Jacobel and Brian Welch, using the ice-penetrating radar system at St. Olaf College in Minnesota, and the other in 2004 by co-author Howard Conway, a UW research professor of Earth and space sciences. Conway noticed the missing layers and asked his colleagues to investigate. “It wasn’t until we had spent probably six months with this data set that we started to piece together the fact that this thing that we could see within the ice sheet was forming in response to the subglacial volcano,” Holschuh said.

The study shows that the mysterious feature originates at the ice covering Mount Resnik. The authors believe that the volcano’s height pushes the relatively thin ice sheet up so much that it changes the local wind fields, and affects depositing of snow. So as the ice sheet passes over the volcano a section missed out on a few annual layers of snow. “These missing layers are common in East Antarctica, where there is less precipitation and strong winds can strip away the surface snow,” Holschuh said. “But this is really one of the first times we’ve seen these missing layers in West Antarctica. It’s also the first time an unconformity has been used to reconstruct ice sheet motion of the past.”

Over time, the glacial record shows that this feature followed a straight path toward the sea. During the 5,700-year record, the five major coastal ice streams are thought to have sped up and slowed down several times, as water on the base lubricates the glacier’s flow and then periodically gets diverted, stalling one of the ice streams. “Despite the fact that there are all these dramatic changes at the coast, the ice flowing in the interior was not really affected,” Holschuh said.

What the feature does show is that a change occurred a few thousand years ago. Previous UW research shows rapid retreat at the edge of the ice sheet until about 3,400 years ago, part of the recovery from the most recent ice age. The volcano track also shows a thinning of the ice at about this time. “It means that the interior of the ice sheet is responding to the large-scale climate forcing from the last glacial maximum to today,” Holschuh said. “So the long-timescale climatic forcing is very consistent between the interior and the coast, but the shorter-timescale processes are really apparent in the coastal record but aren’t visible in the interior.”

Holschuh cautions that this is only a single data point and needs confirmation from other observations. He is part of an international team of Antarctic scientists looking at combining the hundreds of radar scans of Antarctic and Greenland glaciers that were originally done to measure ice thickness. Those data may also contain unique details of the glacier’s internal structure that can be used to recreate the history of the ice sheet’s motion.

“These persistent tracers of historic ice flow are probably all over the place,” Holschuh said. “The more we can tease apart the stories of past motion told by the structure of the ice sheet, the more realistic we can be in our predictions of how it will respond to future climate change.” The research was funded by the National Science Foundation and NASA. The other co-author is Knut Christianson, a UW assistant professor of Earth and space sciences.

Blown soot apparently has no influence on the Antarctic glaciers in the McMurdo dry valleys, Khan et al. 2018 (press release).

Medley & Thomas 2019 documented an increase in snowfall in the Antarctic, which benefited the ice sheet (NASA press release here). The authors establish a connection with the SAM ocean cycle, the Southern Annular Mode. The University of Colorado in Boulder, however, blames the increase in snowfall on the ozone hole (press release, paper by Lenaerts et al. 2018).

Jenkins et al. 2018 pointed to decadal cycles in the melting of the West Antarctic ice sheet at the edge of the Amundsen Sea. The relationship between melting and ocean temperature is nonlinear:

West Antarctic Ice Sheet retreat in the Amundsen Sea driven by decadal oceanic variability

Mass loss from the Amundsen Sea sector of the West Antarctic Ice Sheet has increased in recent decades, suggestive of sustained ocean forcing or an ongoing, possibly unstable, response to a past climate anomaly. Lengthening satellite records appear to be incompatible with either process, however, revealing both periodic hiatuses in acceleration and intermittent episodes of thinning. Here we use ocean temperature, salinity, dissolved-oxygen and current measurements taken from 2000 to 2016 near the Dotson Ice Shelf to determine temporal changes in net basal melting. A decadal cycle dominates the ocean record, with melt changing by a factor of about four between cool and warm extremes via a nonlinear relationship with ocean temperature. A warm phase that peaked around 2009 coincided with ice-shelf thinning and retreat of the grounding line, which re-advanced during a post-2011 cool phase. These observations demonstrate how discontinuous ice retreat is linked with ocean variability, and that the strength and timing of decadal extremes is more influential than changes in the longer-term mean state. The nonlinear response of melting to temperature change heightens the sensitivity of Amundsen Sea ice shelves to such variability, possibly explaining the vulnerability of the ice sheet in that sector, where subsurface ocean temperatures are relatively high.

And here are even more temporally variable relationships. Wang et al. 2019: reported on temporally variable relationships of the surface ice mass balance in West Antarctica with the SAM cycle and ENSO:

A New 200‐Year Spatial Reconstruction of West Antarctic Surface Mass Balance

High‐spatial resolution surface mass balance (SMB) over the West Antarctic Ice Sheet (WAIS) spanning 1800–2010 is reconstructed by means of ice core records combined with the outputs of the European Centre for Medium‐Range Weather Forecasts “Interim” reanalysis (ERA‐Interim) and the latest polar version of the Regional Atmospheric Climate Model (RACMO2.3p2). The reconstruction reveals a significant negative trend (−1.9 ± 2.2 Gt/year·per decade) in the SMB over the entire WAIS during the nineteenth century, but a statistically significant positive trend of 5.4 ± 2.9 Gt/year·per decade between 1900 and 2010, in contrast to insignificant WAIS SMB changes during the twentieth century reported earlier. At regional scales, the Antarctic Peninsula and western WAIS show opposite SMB trends, with different signs in the nineteenth and twentieth centuries. The annual resolution reconstruction allows us to examine the relationships between SMB and large‐scale atmospheric oscillations. Although SMB over the Antarctic Peninsula and western WAIS correlates significantly with the Southern Annular Mode due to the influence of the Amundsen Sea Low, and El Niño/Southern Oscillation during 1800–2010, the significant correlations are temporally unstable, associated with the phase of Southern Annular Mode, El Niño/Southern Oscillation and the Pacific decadal oscillation. In addition, the two climate modes seem to contribute little to variability in SMB over the whole WAIS on decadal‐centennial time scales. This new reconstruction also serves to identify unreliable precipitation trends in ERA‐Interim and thus has potential for assessing the skill of other reanalyses or climate models to capture precipitation trends and variability.”

Scientists: Rising CO2 REDUCES Fires…Australian (Global) Fires Were More Common In Colder (Pre-1950s) Climates

The current furor about an alleged connection between climate change, CO2 emissions, and Australian fires finds no support in the scientific literature. According to scientists, rising CO2 concentrations reduce fire ignition and burned area. Further, both global-scale and Australian fires were far more pervasive during the colder Little Ice Age.

Here’s what the scientific literature has to say about fires and their connection to climate and CO2 concentrations.


1. “Elevated CO2 and warmer climate promote global total tree cover” and higher CO2 “leads to reduced fire ignition and burned area” (Chen et al., 2019).

Image Source: Chen et al., 2019

2. Globally, fires were much more common during the colder Little Ice Age (Yang et al., 2007; Ward et al., 2018; Doerr and Santin, 2016), or before 1900. Fire frequencies have been rapidly declining as CO2 emissions began abruptly rising in the 1940s.

Image Source: Yang et al., 2007

Image Source: Ward et al., 2018

Image Source: Doerr and Santin, 2016

3. There has been a continued decline in global fire since the 21st century began (Earl and Simmonds, 2018).

Image Source: Earl and Simmonds, 2018

4. Australia’s mainland experienced far more pervasive fire during the 1800s to early 1900s, or the Little Ice Age. There has been an abrupt decline in fire activity for the entire Australasian region in the last 50 years (Mooney et al., 2011).

Image Source: Mooney et al., 2011

5. The “assumed positive relationship between drier climates and biomass burning” is not supported by wetter Little Ice Age climates coeval with more burned area in Australia (Tibby et al., 2018).

Image Source: Tibby et al., 2018

6. Australia, like the globe, has neither become wetter or drier over the last 3 decades. There is “no evidence” global precipitation patterns have been been altered by global or regional temperature changes (Nguyen et al., 2018).

Image Source: Nguyen et al., 2018

Image Source: Nguyen et al., 2018

To summarize, the scientific literature does not lend support to claims fires in Australia are connected to warming, rising CO2 emissions, dry climates, or wet climates.

If there were a potential climate linkage, it would be that enhanced fire activity arises in cooler climates.

In other words, there is no apparent link to anthropogenic global warming that can be supported by evidence found in the scientific literature.

Canada’s Missing Heat: Stations Across The Country Show More Cooling Than Warming

By Kirye

and P. Gosselin

Global warming alarmists like claiming that a certain place is seeing more warming and climate change than everywhere else. Remarkably, they say that about almost everywhere, which of course makes no sense.

Today we look at Canadian temperature trends using the data from the Japan Meteorological Institute (JMA) for stations where they have data available going back to at least the mid 1990s.

First we look at December mean temperatures. What follows is a chart depicting the results of 9 stations across Canada:

Of the 9 examined stations, seven show no warming taking place at all in Canada over the past quarter century for the month of December. Data: JMA

The data hardly show the trends you’d expect from a place that is supposed to be “warming faster than anywhere else”.

Canada mean annual temperatures show no warming 

Okay, those are only data for December. How about the annual mean temperatures?

What follows are plots for the mean annual temperatures for the 9 stations:

Data source: JMA

The plots speak clearly enough: we have been seeing more cooling than warming.

Though the surface of the globe may be have warmed modestly as a whole, nothing unusual is going on. What we are likely seeing are mainly natural oceanic cycles at work, which we still know very little about.

By continuing to use the site, you agree to the use of cookies. more information

The cookie settings on this website are set to "allow cookies" to give you the best browsing experience possible. If you continue to use this website without changing your cookie settings or you click "Accept" below then you are consenting to this. More information at our Data Privacy Policy

Close