Growing polar ice mass in a warm world?
Although a number of scientists are hollering that 2017 was “among the warmest on record”, we are not seeing any manifestation of this, at least over the northern hemisphere, where ironically snow and ice have shown surprising extents. This year the northern hemisphere winter has been surprisingly cold and brutal over a number of regions.
Snow and ice cover reach unexpected high levels
Northern Hemisphere snow and ice cover this winter has taken an unexpected turn, reaching surprisingly high levels.
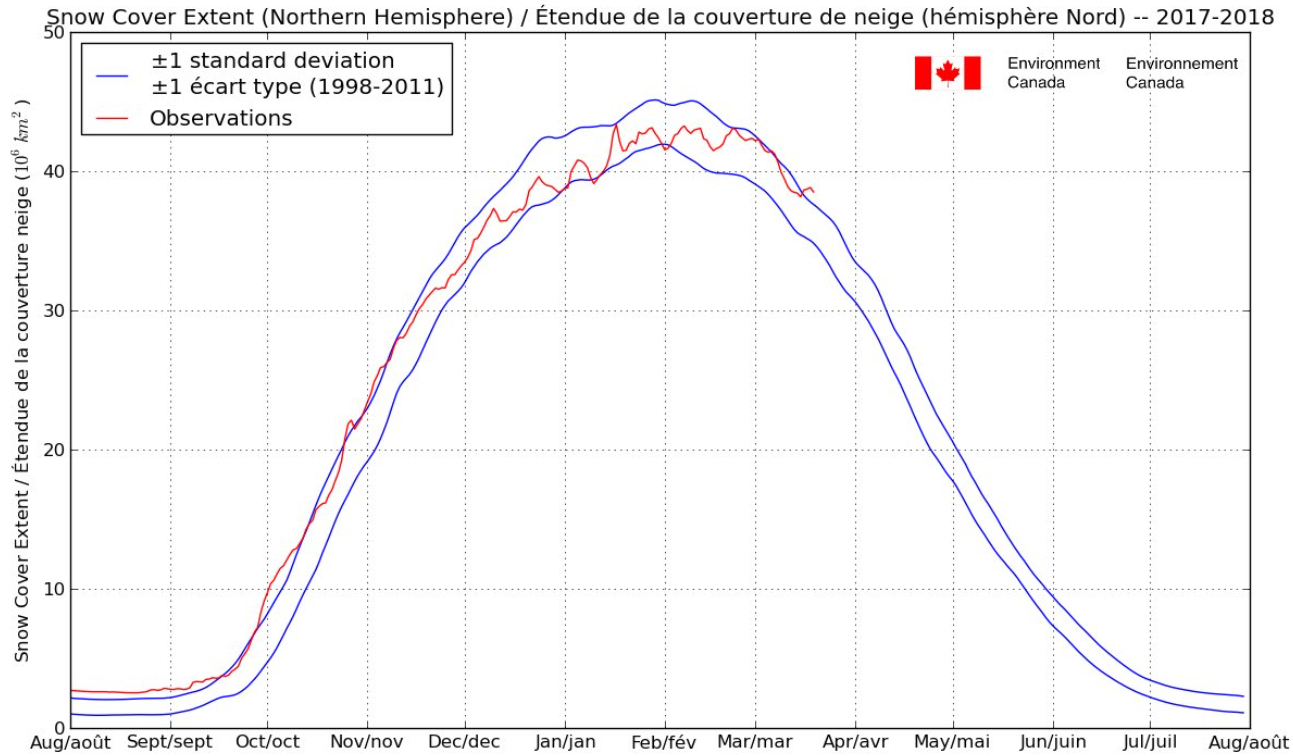
On March 20, 2018, northern hemisphere snow and ice cover was over 1 standard deviation above normal. Source: Environment Canada.
As the above chart shows, over much of the winter of 2017/2018, snow and ice cover was well above normal, bucking the assumption that warm surface means it’s warm everywhere. That’s a clear sign that climate is a lot more just than a few measurement points at the surface.
And with all the surface “warmth” allegedly occurring at the Arctic this winter and the recent consecutive years of “record high global temperatures”, one would have to logically conclude the Arctic and Antarctic have to be melting rapidly. Yet snow cover data show a very different story:
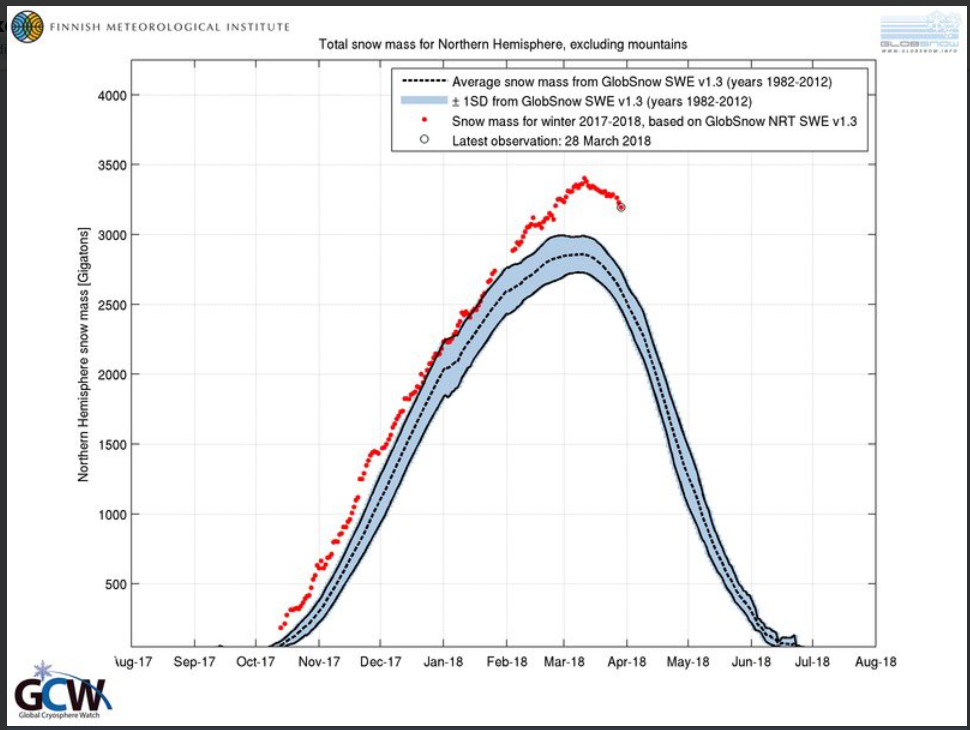
Total northern hemisphere snow and ice cover this winter has been exceptionally high, according to the Finnish Meteorological Institute.
Cold below the surface?
Ice cover area is only one indicator of the climate system. More important is Arctic sea ice volume, as ice shrinks when it warms and grows when it cools.
Looking at the Arctic sea ice volume on March 15, 2018, we see that it is far above what was recorded 10 years earlier:
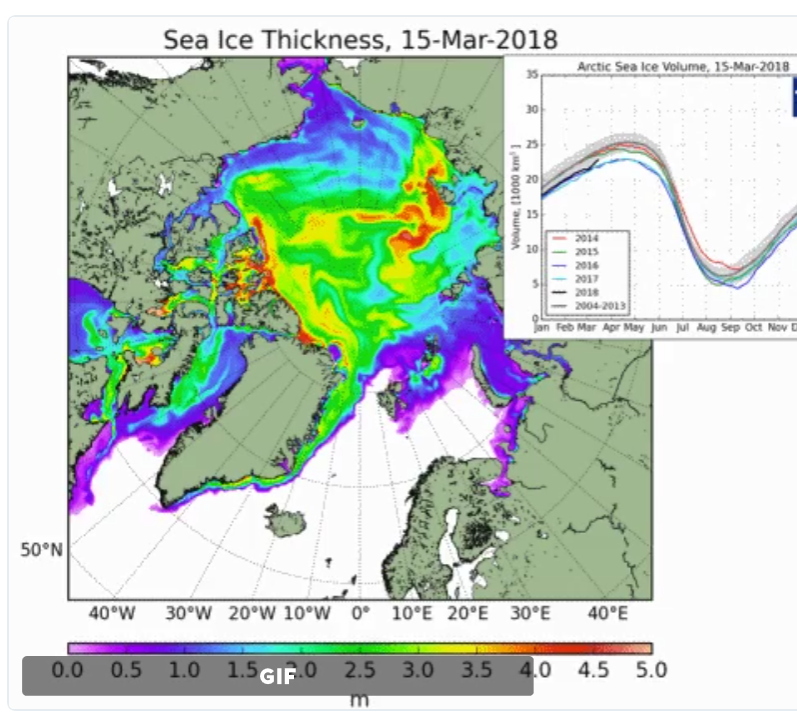
Arctic sea ice volume has rebounded and is close to normal levels, despite the very warm surface conditions in the Arctic this past winter. This can only indicate that other sub surface cooling factors (such as ocean dynamics) are at play.
This shows us that surface warming does not say anything about global warming, and vice versa when it comes to cooling.
Antarctic cooling in a warming planet?
No place has bucked warming more than Antarctica, which has shown a clear growing sea ice cover since 1980. A recent study concluded:
Compelling evidence indicates that the large increase in the SH sea ice, recorded over recent years, arises from the impact of climate modes and their long-term trends.”
In other words, it gets down to below surface ocean and above surface solar cycles.
Surface climate is not global climate
Global surface temperatures are arguably a very poor indicator of global temperature. Surface is only a thin slice from a vast system.
Above the earth’s surface we have miles of highly dynamic atmosphere. And above that we have the tempestuous moods of the sun, which ultimately fuels the entire earth climate system. Below the earth’s surface we have kilometers of a vast dynamic ocean, whose mass is 100 times that of the atmosphere above us.
The reality: the earth’s thin surface tells us almost nothing about the entire seabed-to-ionosphere system.
Calling the conditions at the surface “global climate” is extremely narrow minded. It’s like a traffic engineer measuring the number of cars going by at one point along an unknown street only once over 30 seconds and hoping that data will let him to accurately calculate total traffic flow over a whole day, month or an entire year.
Missing data volume 10,000 to 1
The ocean is in a state of constant of flux involving huge complex currents and cycles with periods ranging from months to centuries. Very few of these cycles are understood to any appreciable extent. Scientists are still not able to forecast the ENSO.
Moreover at the seabed there are also thousands of active volcanoes. No one could possibly know what climate-impacting beasts lurk beneath the surface of the oceans.
So when it comes to making useful predictions, the data volume we are missing is conservatively 10,000 times greater than the scant data we have collected thus far. So any scientist who claims he can make a reliable forecast 100 years out must either be incompetent, or a fraud.
Ocean surface temperatures have cooled recently
To show how fast things can change, the following chart shows how much ocean surface temperature changed in just one week:
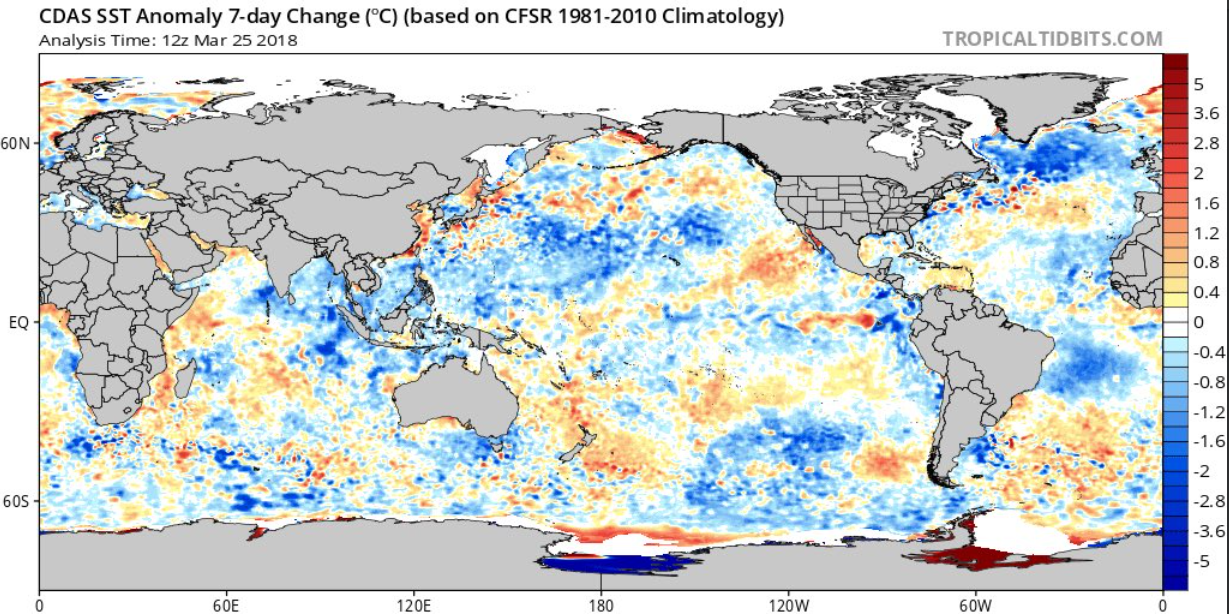
Ocean surface temperatures showed widespread cooling over the past 7 days. Source: Tropical Tidbits
This means that the oceans are real, unpredictable climate drivers.


“Arctic sea ice volume has rebounded and is close to normal levels,”That would be some feat, if true.
http://psc.apl.uw.edu/research/projects/arctic-sea-ice-volume-anomaly/
https://nsidc.org/data/seaice_index/images/daily_images/N_iqr_timeseries.png
And I predict there will not be a similar article posted in June …
https://www.ncdc.noaa.gov/snow-and-ice/extent/snow-cover/namgnld/6
It is true. And what does ice volume have to do with sea ice area and what does June snow cover have to do with winter snow cover? BTW, Arctic ice extent of course trends down – when you start the graph at the 1980 peak. Sea ice was also low in the 1950s. Fact is that ice volume is greater today than 10 years ago (2008).
Actually, Arctic sea ice cover is STILL in the top 10% of Holocene sea ice extent.
It is still ANOMALOUSLY HIGH compared to anything but the bitterly cold period of the LIA.
Here’s sea ice cover in crucial regions around the Arctic
https://s19.postimg.org/a2p8qx7oz/Arctic-_Sea-_Ice-_Changes-_Chukchi-_Sea-_Yamamoto-2017.jpg
https://s19.postimg.org/v6om69bj7/Arctic-_Sea-_Ice-_Extent-_North-of-_Iceland-3000-_Years-_Moffa-_S_nchez-.jpg
Icelandic records show the late 1970’s was up there with the EXTREME extent of the LIA
https://s19.postimg.org/bkgbf2prn/Icelandic_sea_ice_index_2.png
Its only if you are dumb and ignorant enough to consider the LIA as being a “desirable” and “normal” period for the climate, that Arctic sea ice can be used as a chicken-little AGW prop.
If you look at the Russia sea ice charts, they back up exactly what Pierre has said. They show FAR more “old ice” in 2018 than in 2008.
https://s19.postimg.org/7u9de975v/Russian_ice.jpg
Interesting to see a parrot make predictions, usually they just copy/paste.. 😉
Speaking of “ANOMALOUSLY HIGH,” I wonder which of our chatbot trolls this one is?
https://vignette.wikia.nocookie.net/basilicus/images/8/8a/Hippy-dog.jpg/revision/latest?cb=20120321180852
…and why he’s not more mellow.
“Arctic sea ice volume has rebounded and is close to normal levels, despite the very warm surface conditions in the Arctic this past winter. This can only indicate that other sub surface cooling factors (such as ocean dynamics) are at play.
Extent and area are the least reliable sea ice indicators of climate and temperature. The most dynamic changes of those metrics in the shorter term occur due to storms, wave, and wind action.
I’ll start paying attention to extent/area of sea ice when, over a longer period they grow to threaten to encompass Iceland, as occurred a couple times during the LIA.
Other than that they are metrics better suited for local navigation and logistics than assessing climate or temperature.
Yep, a more open Arctic, as in the MWP, RWP and all the first 80% of the Holocene would be an absolute blessing for people trying to live up there.
Travel, exploration, commerce, fishing etc all would become viable enterprises like THEY ONCE USED TO BE.
(as proven by the existence of whaling stations dotted around the Arctic)
Why do Arctic sea ice bed-wetter HATE the people living up there so much ?????
I would be more accurate to say that there is a kind of plateau in Arctic ice extent since 2007. For a prior period from about 1994 there was marked decline in extents, but now mainly fluctuations around a steady state. This has little to do with CO2, much to do with pulses of warm Atlantic water, along with wind and weather moving the drift ice around and compacting in various places. What is different lately, as shown in the volume chart above, is the increase in thickness over the pole joining Laptev, Kara and East Siberian seas with the Canadian Archipelago. This ice pack may prove resistant to typical melting, we shall see. Of course, there is always the chance of a storm like the Great Cyclone in 2012.
A recent look shows Barents growing a surprising amount of ice in March:
https://rclutz.files.wordpress.com/2018/03/barents-day087.png
https://rclutz.wordpress.com/2018/03/29/barents-ice-machine/
Exactly – look below the surface to find out why Arctic changes. The same is true at the other pole.
Two points do not give you a trend.
“BTW, Arctic ice extent of course trends down – when you start the graph at the 1980 peak.”
Oh Really?
https://tinyurl.com/ybro29kq
Oh, yes – Grant Foster. That says it all.
Warning low-info alert: Philip Clarke doesn’t realise that his linked graph takes two different data types that are spliced together with the pretension that they can be compared directly. Direct observations are far more accurate and do not the possess the low-pass filter that every proxy data must inevitably possess.
The blue-dotted “modern observations” line doesn’t even take into account pre-satellite observations that show that Arctic ice has been about as low as it is today back in the 1970s. https://1.bp.blogspot.com/-BYpmzaAMaU0/VvpOS4m7pnI/AAAAAAAANV4/yebBb1NdUVocp3qv1ZhG0lWadBYNftPzw/s1600/ipcc%2Bfar%2Bsea%2Bice%2BNH.png
When will climate-adherents realise that floating Arctic ice is a poor measure of global average temperature and doesn’t mean anything? Your ice proxy data doesn’t even show the medieval warm period or Roman warm period; it’s pathetic.
That’s the exact same thing that the entire “unprecedented” narrative is based on. For example:
https://notrickszone.com/wp-content/uploads/2017/08/Hide-the-Decline-Using-Mikes-Nature-Trick.jpg
https://notrickszone.com/wp-content/uploads/2017/08/Holocene-Cooling-Northern-Hemisphere-Briffa-2002-Divergence.jpg
Why do you still kind of claim that the tree ring proxy records are the truth and instrumental records are fake?
Why do you STILL not comprehend basic mathematical principles ??
Why are you STILL unable to produce one single piece of actual science showing that enhanced atmospheric CO2 causes anything but enhanced plant growth?
roflmao.
You can tell where you have been getting your mindless propaganda , Phlop.
Getting it out of the sewer of AGW apologists.
Most recent and CORRECT Arctic sea ice reconstruction.
https://s19.postimg.org/hcmhnqak3/Arctic-_Sea-_Ice-_Alekseev-2016-as-shown-in-_Connolly-2017.jpg
And it even matches the temperature of the region.
https://s19.postimg.org/vws4z68s3/arctic_temp.png
Chuckle, two trends grafted together with very different data resolutions, I’m just a layman but even I’m a wake-up to that old alarmists’ trick.
cAGW started at the beginning of the Cretinaceous Period or the Hubrisoscene 🙂
🤣
You coin some delightful terms.
I accept that what you say is possible but I think that atmospheric pressure is the thing that drives surface temperatures at high latitude, high pressure in winter means more heat loss and less solar radiation to replace that heat loss while low pressure means less heat loss when there is less solar radiation. There could be a link between ocean conditions and atmospheric pressure. From the eighties to around 2010 a positive AO and NAO dominated the northern hemisphere while Arctic sea ice minimum declined. I think it depend which way the AO and NAO go during this solar minimum that will determine if we continue to warm or cool down in the Northern Hemisphere.
Do you have any response beyond an ad hom?The data plotted is from a paper that demonstrates the recent decline in Arctic Ice extent is indeed extraordinary
“Arctic sea ice extent is now more than two million square kilometres less than it was in the late twentieth century, with important consequences for the climate, the ocean and traditional lifestyles in the Arctic1,2. Although observations show a more or less continuous decline for the past four or five decades3,4, there are few long-term records with which to assess natural sea ice variability. Until now, the question of whether or not current trends are potentially anomalous5 has therefore remained unanswerable. Here we use a network of high-resolution terrestrial proxies from the circum-Arctic region to reconstruct past extents of summer sea ice, and show that— although extensive uncertainties remain, especially before the sixteenth century—both the duration and magnitude of the current decline in sea ice seem to be unprecedented for the past 1,450 years”
Kinnard et al 2011
http://projects.iq.harvard.edu/files/climate/files/kinnardetal2011.pdf
Surface. Temperatures. Mean. Little. Read the post.
Arctic sea ice today is only extraordinary if you believe the author of the paper you cite. I don’t. Other alarmists believe, er- want others to believe, that today’s temperatures are the hottest in a million years, or that the temperature rise of the past 50 years is unprecedented. Way too much other literature out there showing it isn’t so. Also the scientists you often cite have blown their scientific reputations through their open activism. I really believe these people are paid bullshit artists, who successfully con weaker minds.
Now of course, do continue zealously insisting the world is ending, if that’s what makes you feel better.
Arctic sea ice is NOW in the top 10% of the last 10,000 years.
It is ANOMALOUSLY HIGH as its strives to RECOVER from the EXTREMES of the LIA.
DO
YOU
COM-
PRE-
HEND !!
An unusual accurate self-description of the “skeptics scene” …
Zero content, as usual, hey seb.
Do you DENY that the LIA was a period of ANOMALOUS COLD?
Do you DENY that the warming out of that COLDEST period in 10,000 years has been highly beneficial to human existence?
It’s not even “extraordinary” relative to the first half of the 20th century (the 1920s-1940s).
The “extraordinary” part is how high the sea ice extent got during the Little Ice Age. We’re only slightly lower than that now.
https://notrickszone.com/2018/03/01/another-new-paper-shows-arctic-sea-ice-has-been-increasing-overall-since-the-1930s/
Phil, since you believe that humans are the cause of the current decline in the NH, what’s the cause of the Southern Hemisphere sea ice increasing for the last 37 years?
Arctic sea ice concentration grew between the 1940s and 1980s, with pronounced spikes in the 1960s.
The Canadian Arctic hasn’t even warmed in the last 150 years (“Although biological production increased in the last 150 yr, the reconstructed temperatures do not indicate a warming during this time.” – Fortin and Gajewski, 2016).
Considering these trends, does this anthropogenic causal mechanism you believe in only work in certain decades, or in one hemisphere and not the other? If so, explain how causal mechanisms turn on and off, depending on the decade and hemisphere. Please use scientific papers to support your positions.
Can we assume you don’t agree with scientists who find that natural variability can explain the warming in the Arctic in recent decades?
—
Ding et al., 2014
“Here we show that the recent warming in this region [northeastern Canada and Greenland] is strongly associated with a negative trend in the North Atlantic Oscillation, which is a response to anomalous Rossby wave-train activity [planetary waves related to the Earth’s rotation] originating in the tropical Pacific. … This suggests that a substantial portion of recent warming in the northeastern Canada and Greenland sector of the Arctic arises from unforced natural variability.”
—
Ohashi and Tanaka, 2010
“Since the decadal variation of the AO is recognized as the natural variability of the global atmosphere, it is shown that both of decadal variabilities before and after 1989 in the Arctic [cooling, then warming] can be mostly explained by the natural variability of the AO [Arctic Oscillation] not by the external response due to the human activity.”
Poor Phlop, you really should look at what you are copy/pasting, try to engage you single brain neurone first.
Kinnard et. al 2011 turns out to be a paper in Nature 479: 509-512. Paywalled, but the abstract gives the bogus game away.
Kinnard’s paleo proxy sea ice reconstruction was made from circumpolar TERRESTRIAL temperature proxies (tree rings, lake sediments), which were then used to model (guesstimate) what the sea ice might have been based on temperature.
Its complete garbage, because sat measured sea ice declined during the sat and ground measured temperature pause post 2000. The abstract even says, “extreme uncertainties remain”.
Of course, since sea ice declined post 2000 despite the temperature pause. Onto this non sea ice based guess was appended the satellite measurements (dotted portion of graph.
The reconstruction result defies science common sense in addition to coming from a totally bastardized methodology.
Its just the sort of MONUMENTAL JUNK that we would expect from a mindless, zero-thought parrot.
Tree line studies indicate that the current Arctic temperatures have not reached those during the MWP nor the temperatures during most of the Holocene, so far.
Climate change and the northern Russian treeline zone (2007 G.M MacDonald K.V Kremenetski, D.W Beilman):
http://rstb.royalsocietypublishing.org/content/363/1501/2283
“… Dendroecological studies indicate enhanced conifer recruitment during the twentieth century. However, conifers have not yet recolonized many areas where trees were present during the Medieval Warm period (ca AD 800–1300) or the Holocene Thermal Maximum (HTM; ca 10 000–3000 years ago) …”.
In 1921, the waters on the north shore of Spitzbergen were ice free
https://s19.postimg.org/lomprmi3n/lanser_holocene_figure11.png
In 1976, sea ice came to the shores of Iceland for the first time 40 years.
HISTORY is against the AGW scam
DENY NATURAL CLIMATE CHANGE all you want, phlop,
…it just makes you look like a mindless parrot
It’s getting insane … to what lengths you go to troll people …
You need to DENY climate history, don’t you seb.
History DESTROYS the AGW mantra.
We are still very much at a COLD period in the current interglacial, only a tiny bump above a massively cold anomaly.
Do you DENY this fact?
Looks like Phil has taken over as resident troll.
DNFTT
“Phil, since you believe that humans are the cause of the current decline in the NH, what’s the cause of the Southern Hemisphere sea ice increasing for the last 37 years?”
Say what?
https://phys.org/news/2018-03-antarctic-sea-ice-second-straight-year.html
2 years is climate!
Yes, it’s called a trend, Philip. They are different from one- or two-year anomalies, since, as you may know, there were about 10 “most-ever” monthly sea ice records during the 2012-2014 years. The trend for Southern Hemisphere sea ice has been increasing since 1979, which corresponds to the cooling Southern Ocean. Antarctic sea ice is no lower now than it was in the early 1900s, in line with the lack of centennial-scale warming in this region.
I’ll provide some scientific backup for this, and then perhaps you can answer the question: What’s the causal mechanism for the Southern Ocean cooling and SH sea ice extent increase since 1979?
Comiso et al., 2017
http://journals.ametsoc.org/doi/abs/10.1175/JCLI-D-16-0408.1
The Antarctic sea ice extent has been slowly increasing contrary to expected trends due to global warming and results from coupled climate models. After a record high extent in 2012 the extent was even higher in 2014 when the magnitude exceeded 20 × 106 km2 for the first time during the satellite era. … [T]he trend in sea ice cover is strongly influenced by the trend in surface temperature [cooling].
—
Schroeter et al., 2017
http://www.the-cryosphere.net/11/789/2017/tc-11-789-2017.pdf
Antarctic sea ice extent has increased by approximately 1.5 % per decade since satellite observations began in 1979 (Parkinson and Cavalieri, 2012; Turner et al., 2015). … By contrast, models in the Coupled Model Intercomparison Project Phase 5 (CMIP5) exhibit decreasing sea ice trends in all months (Turner et al., 2013a). The reasons for the disparity between observed and modelled trends are not yet well understood (Bindoff et al., 2013; Hobbs et al., 2016).
—
Mezgec et al., 2017
https://www.nature.com/articles/s41467-017-01455-x
The causes of the recent increase in Antarctic sea ice extent, characterised by large regional contrasts and decadal variations, remain unclear. … Simulations performed with state-of-the-art climate models fail to capture such a sea ice increase.
—
Cerrone and Fusco, 2017
http://journals.ametsoc.org/doi/abs/10.1175/JCLI-D-17-0184.1
Compelling evidence indicates that the large increase in the SH [Southern Hemisphere] sea ice, recorded over recent years, arises from the impact of climate modes and their long–term trends. The examination of variability ranging from seasonal to interdecadal scales, and of trends within the climate patterns and total Antarctic sea ice concentration (SIC) for the 32–yr period (1982–2013) are the key focuses of this paper. Our results indicate that a progressive cooling affected the year–to–year climate of the sub–Antarctic since 1990s.
—
Edinburgh and Day, 2016
http://www.the-cryosphere.net/10/2721/2016/tc-10-2721-2016.pdf
In stark contrast to the sharp decline in Arctic sea ice, there has been a steady increase in ice extent around Antarctica during the last three decades, especially in the Weddell and Ross seas. In general, climate models do not to capture this trend … This comparison shows that the summer sea ice edge was between 1.0 and 1.7° further north in the Weddell Sea during this period but that ice conditions were surprisingly comparable to the present day [during 1897-1917] in other sectors.
—
Easterbrook, 2016
http://www.sciencedirect.com/science/article/pii/B9780128045886000070
Antarctic satellite temperatures show no warming for 37 years. The Southern Ocean around Antarctica has cooled markedly since 2006. Sea ice has increased substantially, especially since 2012. Surface temperatures at 13 stations on or near the Antarctic Peninsula have been cooling sharply since 2006. Ocean temperatures have been plummeting since about 2007, sea ice has reached all-time highs, and temperatures have been cooling since 2000. The Larsen Ice Shelf Station has been cooling at an astonishing rate of 1.8°C per decade (18°C per century) since 1995.
—–
Hobbs et al., 2016
http://www.sciencedirect.com/science/article/pii/S0921818116300364
Over the past 37 years, satellite records show an increase in Antarctic sea ice cover that is most pronounced in the period of sea ice growth.
————————————————
For that matter, why hasn’t Antarctica warmed in the last 100 years? Why has the Antarctic Peninsula been cooling rapidly (-0.47°C per decade) since 1999? What’s the causal mechanism for all this cooling and sea ice growth, Philip?
Oliva et al., 2017
http://www.sciencedirect.com/science/article/pii/S0048969716327152
However, a recent analysis (Turner et al., 2016) has shown that the regionally stacked temperature record for the last three decades has shifted from a warming trend of 0.32 °C/decade during 1979–1997 to a cooling trend of − 0.47 °C/decade during 1999–2014. … This recent cooling has already impacted the cryosphere in the northern AP [Antarctic Peninsula], including slow-down of glacier recession, a shift to surface mass gains of the peripheral glacier and layer of permafrost in northern AP islands.
Philip Clarke
And here’s evidence of a 2 hour trend in Britain…
Good Friday in the warmer West of England…
https://twitter.com/CarlBovisNature/status/979737348631093248
The trend continues with the evidence from this radar snap-shot for Saturday 31 March at 08:35 …
https://uploads.disquscdn.com/images/276c7ec2c6cea9a5ae79ecaa5a61e03d606328ed5b8f49e5c3d3b696cb711dcf.png
I wonder if little Phloppy has looked at what the Antarctic sea ice is doing this year.
Climbing rapidly, already above 2002, 2006, 2007, 2009, 2010, 2017. (my table only goes back to 1998)
SunshineHours shows more years.
https://sunshinehours.files.wordpress.com/2018/03/antarctic_sea_ice_extent_zoomed_2018_day_88_1981-2010.png?w=1024&h=682
The 2nd image has the title:
“Total snow mass for Northern Hemisphere, excluding Mountains”
That’s a bit confusing.
Does this mean there is a data-base for permanent snow mass, or some other such thing, so that this chart shows snow for the current winter season only?
Just thought this is interesting, and likely could look it up. But I don’t have time right now.
I’ve been following this chart that has measurements of snow-water equivalent by drainages in western North American US-States. These data are used by irrigators for planning.
” What’s the causal mechanism for the Southern Ocean cooling and SH sea ice extent increase since 1979?”
What cooling? The sea ice is complicated, but here you go ….
“Moreover, since the 1950s the Southern Ocean has been warming faster than other oceans in the world (Gille 2002); the average global ocean temperature in the upper 1000 m has increased by 0.1°C between 1955 and 1995 (Levitus et al. 2000), whereas the middepth Southern Ocean temperatures have increased by 0.17°C. Although satellite observations over 1982–98 show a cooling over parts of the Antarctic continent, a general warming occurred in the surface temperature of the peripheral seas (Kwok and Comiso 2002).”
“Estimates of sea ice extent based on satellite observations show an increasing Antarctic sea ice cover from 1979 to 2004 even though in situ observations show a *prevailing warming trend* in both the atmosphere and the ocean. […] The model shows that an increase in surface air temperature and downward longwave radiation results in an increase in the upper-ocean temperature and a decrease in sea ice growth, leading to a decrease in salt rejection from ice, in the upper-ocean salinity, and in the upper-ocean density. The reduced salt rejection and upper-ocean density and the enhanced thermohaline stratification tend to suppress convective overturning, leading to a decrease in the upward ocean heat transport and the ocean heat flux available to melt sea ice. The ice melting from ocean heat flux decreases faster than the ice growth does in the weakly stratified Southern Ocean, leading to an increase in the net ice production and hence an increase in ice mass. This mechanism is the main reason why the Antarctic sea ice has increased in spite of *warming conditions both above and below* during the period 1979–2004 and the extended period 1948–2004.”
Zhang et al 2007
http://psc.apl.washington.edu/zhang/Pubs/Zhang_Antarctic_20-11-2515.pdf
See below. I’ll ask my question for a 3rd time, since you keep on denying that (a) sea ice extent has increased, and (b) the Southern Ocean has cooled. Considering you believed humans caused the warming and Arctic sea ice decrease in the last few decades with their CO2 warming pollution, what was the causal mechanism for the cooling and sea ice growth in the SH considering that region was inflicted with the same CO2 warming pollution that you believe caused the warming/decline?
Southern Ocean cooling since 1979 (Purich et al., 2018)
Purich et al., 2018
http://journals.ametsoc.org/doi/abs/10.1175/JCLI-D-17-0092.1
Observed Southern Ocean changes over recent decades include a surface freshening (Durack and Wijffels 2010; Durack et al. 2012; de Lavergne et al. 2014), surface cooling (Fan et al. 2014; Marshall et al. 2014; Armour et al. 2016; Purich et al. 2016a) and circumpolar increase in Antarctic sea ice (Cavalieri and Parkinson 2008; Comiso and Nishio 2008; Parkinson and Cavalieri 2012). … [A]s high-latitude surface freshening is associated with surface cooling and a sea ice increase, this may be another factor contributing to the CMIP5 models excessive Southern Ocean surface warming contrasting the observed surface cooling (Marshall et al. 2014; Purich et al. 2016a), and sea ice decline contrasting the observed increases (Mahlstein et al. 2013; Polvani and Smith 2013; Swart and Fyfe 2013; Turner et al. 2013; Zunz et al. 2013; Gagne et al. 2015) over recent decades. … Our results suggest that recent multi-decadal trends in large-scale surface salinity over the Southern Ocean have played a role in the observed surface cooling seen in this region. … The majority of CMIP5 models do not simulate a surface cooling and increase in sea ice (Fig. 8b), as seen in observations.
Southern Ocean cooling since 1979 (Fan et al., 2014)
Fan et al., 2014
https://agupubs.onlinelibrary.wiley.com/doi/pdf/10.1002/2014GL059239
For the Southern Ocean as a whole, SST has decreased by approximately 0.6°C in DJF [summer] (0.4°C in the annual mean) while Antarctic SIC [sea ice concentration] has increased by approximately 9% in DJF (12% in the annual mean) during 1979–2011. … Cooling is evident over most of the Southern Ocean in all seasons and the annual mean, with magnitudes approximately -0.2–0.4°C per decade or -0.7–1.3°C over the 33 year period [1979-2011]. Sea ice concentration (SIC) trends are generally consistent with the SST trends: that is, regions of increasing SIC are nearly always found in an environment of decreasing SST, and vice versa [warmer SSTs cause less SIC].
Poor Phlop the parrot.
More mindless copy/paste of content he obviously does NOT understand.
Did he even see the words.. “the model shows”
DATA, not non-validated ASS-umption driven models, Phlop
http://kaltesonne.de/wp-content/uploads/2015/04/ant3.gif
And you do know that before 2003 there were basically no real measurements for ocean temperature for the Southern ocean, don’t you.
https://s19.postimg.org/46xcg7377/figure-42.png
.. Even Phil Jones from CRU admitted that they were “mostly made up”
WOW, German wind and solar going GRATE !!!
https://sunshinehours.files.wordpress.com/2018/03/capture3.jpg
0.00GW from solar.
1.13GW from wind.
9.27GW from nuclear.
45.5GW from CO2 producing power plants (gas, coal, biomass, oil)
Wind and solar really are WHY BOTHER sources of electricity, when you have to have basically 100% backup anyway because of the absolute UNRELIABILITY of wind and solar!
Its sort of like paying a housekeeper extra to trash your house.
Is that table telling us there was no solar at 8pm in March?
I wonder why not?
Windless….
And so wonderful that you realise the BIG drawback of solar.
It is totally ABSENT when needed for the evening peak.
Tiny steps, little trollette !!
Is it a sign of trolling if someone ignores timezones or can we chalk that up to the usual ignorance? The data in that screenshot is from 5 am March 27th CET.
No matter where you are, the Sun doesn’t shine at night. Solar energy is totally ABSENT for large parts of the 24 hour day.
Or were you ignorant of that fact as well?
https://data.giss.nasa.gov/cgi-bin/gistemp/stdata_show.cgi?id=301889630008&dt=1&ds=5
https://s19.postimg.org/yubej7oyr/ant-ta-monthly-1979-2016-11-01.gif
https://s19.postimg.org/nn6qmzrb7/antarcticacooling.gif
https://i1.wp.com/oceanbites.org/wp-content/uploads/2016/10/AP_temp.png
http://www.john-daly.com/stations/vostok.gif
https://s3.amazonaws.com/jo.nova/graph/temp/polar/antarctic/march-2016-south-pole-uah-ken.gif
Maybe engage your brain-hosed sludge and wonder why a place of human inheritance show an increase while everywhere else shows COOLING?
“inheritance”… ?????
I wrote inhabitance….
The Northern Hemisphere snow area is particularly significant. If you get exceptional snow in a place like Chicago or Winnipeg you can always blame it on increased precipitation caused by higher temperatures. After all if these places are normally subzero during the winter snowfall is likely to be driven by precipitation not temperature. So on a global scale we might experience more snow in those places where average winter temperatures have not yet risen about zero. And on the periphery of the zero isotherm you would expect less snow, as in these places snow is driven more by temperature. For example if it snows heavily in Barcelona you can’t blame that on global warming.
So globally, in a warming world you would expect a redistribution of snow from areas that currently experience only intermittent snow, polewards to still cold areas. The “snow line” should be traveling northwards. You don’t need to be a genius to realise that this must result in decreased area under snow. The fact that no such trend exists tends suggests that you cannot blame extreme snow on global warming.
Surface temperature should be looked at as a reflection of climate and not a driver. The sun brings the energy in, and water in one form or another moves it around and suface temperature reflects that movement in real time.
Just maybe there are more than one factors at work…”While the Arctic region has been warming strongly in recent decades, anomalously large snowfall in recent winters has affected large parts of North America, Europe, and east Asia. Here we demonstrate that the decrease in autumn Arctic sea ice area is linked to changes in the winter Northern Hemisphere atmospheric circulation that have some resemblance to the negative phase of the winter Arctic oscillation. However, the atmospheric circulation change linked to the reduction of sea ice shows much broader meridional meanders in midlatitudes and clearly different interannual variability than the classical Arctic oscillation. This circulation change results in more frequent episodes of blocking patterns that lead to increased cold surges over large parts of northern continents. Moreover, the increase in atmospheric water vapor content in the Arctic region during late autumn and winter driven locally by the reduction of sea ice provides enhanced moisture sources, supporting increased heavy snowfall in Europe during early winter and the northeastern and midwestern United States during winter. We conclude that the recent decline of Arctic sea ice has played a critical role in recent cold and snowy winters.”
http://www.pnas.org/content/early/2012/02/17/1114910109?sid%3D79cf5938-077b-4581-b260-bc854c4c7917=
It’s one theory that rapidly popped up after the predictions of “snowless winters” collapsed.
So when the predictions for decreased snowfall fail, it’s time to come up with new explanations as to why the wrong predictions were right all along. It’s the unfalsifiable hypothesis (i.e., belief).
—-
♦ Kunkel et al., 2002: “Surface conditions favorable for heavy lake-effect snow decreased in frequency by 50% and 90% for the HadCM2 and CGCM1 [models], respectively, by the late 21st Century. This reduction [according to models] was due almost entirely to … an increase in average winter air temperatures.”
♦ IPCC AR4 (2007): “Snow season length and snow depth are very likely to decrease in most of North America”
♦ Kapnick and Delworth, 2013: “In response to idealized radiative forcing changes, both models produce similar global-scale responses in which global-mean temperature and total precipitation increase while snowfall decreases. … By using a simple multivariate model, temperature is shown to drive these trends by decreasing snowfall almost everywhere” (press release) “In North America, the greatest reductions in snowfall will occur along the northeast coast, in the mountainous west, and in the Pacific Northwest. Coastal regions from Virginia to Maine … will get less than half the amount of snow currently received.”
Kunkel … “by the late 21st Century”
IPCC … “in the 21st century.”
Kapnick and Delworth “over the next century.”
I think we’re in the 21st century, Philip. So when do you think these predictions might be realized?
When will you be answering the question? Why has the sea ice been growing in the Southern Ocean with all the CO2 warming pollution swirling around down there?
For that matter, why has the North Atlantic been cooling — dramatically in the last 12 years? What’s the mechanism?
https://notrickszone.com/wp-content/uploads/2018/02/North-Atlantic-SST-Cooling-Since-1985-Smeed-2018.jpg
Yeah, what IS the mechanism, Kenneth? Explain it to us in your own words.
Solar heat is absorbed by the oceans and mixed/redistributed on multidecadal timescales in tandem with the AMO, PDO, NAO, etc.
The same factors leading to cooling are the ones attributed to the warming.
Piecuch et al., 2017
Mechanisms underlying recent decadal changes in subpolar North Atlantic Ocean heat content
“Changes in the heat content of an oceanic control volume can be caused by convergences and divergences of advective, diffusive, and surface heat fluxes within the control volume. [Advective heat convergence] explains 87% of the total [ocean heat content] variance, the former [warming] showing similar decadal behavior to the latter [cooling], increasing over 1994–2004, and decreasing over 2005–2015. … These results demonstrate that the recent SPNA decadal trend reversal was mostly owing to advective convergences by ocean circulation … [D]ecadal variability during 1993–2015 is in largest part related to advection by horizontal gyres.”
Good, and now take the leap and imagine what happens if the total heat content increases despite some region’s heat content (at least near the surface) decreasing.
“and now take the leap and imagine “
No, we are NOT AGW sicko-phants. !!
Why are you so much against the world RECOVERING NATURALLY from the COLDEST ANOMALY in 10,000 years. ??
Its bizarre IDIOTIC behaviour.
[…] Fonte: No Tricks Zone […]
“When will you be answering the question? Why has the sea ice been growing in the Southern Ocean with all the CO2 warming pollution swirling around down there?”
Already answered. See Zhang et al
https://journals.ametsoc.org/doi/abs/10.1175/JCLI4136.1
“For that matter, why has the North Atlantic been cooling — dramatically in the last 12 years? What’s the mechanism?”
You could always try actually reading Sneed et al, where you got the graph. The Atlantic Meridional Overturning Circulation (AMOC) has weakened, as predicted by climate models. As it is a major mechanism for ocean heat transfer, some areas have cooled, others warmed. See the last panel of Figure 2, the yellow areas are +0.5C, blue -0.5C.
So what?
Uh, no, a single 2007 paper doesn’t answer the question. You’ve denied that both the Southern Ocean SSTs have been cooling and that the sea ice area has increased since the late 1970s. In other words, you’ve been denying the observations.
Prior to the late 1970s (the 1940s to 1970s, the Southern Ocean was warming and the sea ice declining. Conversely, during that same period, the Arctic sea ice decreased as the Arctic cooled. See how this works, Philip? It’s oscillatory, in line with the NAO in the NH and the SAM in the SH. There is no linearly-increasing anthropogenic CO2 pollution signature detectable.
But you go on ahead and keep believing that CO2 pollution is what’s causing Arctic sea ice to decline…and that the Southern Ocean hasn’t been cooling or the sea ice extent increasing. That’s all this is for you: an unfalsifiable hypothesis.
Do you think you’re convincing anyone here about the dangers of anthropogenic CO2 pollution?
“Do you think you’re convincing anyone here about the dangers of anthropogenic CO2 pollution?”
Only convincing he has manages is of the total brain-hosed non-thinking and base-level ignorance of the usual AGW apologist/troll.
I actually find it quite amusing to see someone so TAKEN-IN, and totally CONNED by the whole AGW scam.
Maybe even a worse case of brain-hosing than the other AGW sympathiser that yaps mindlessly here.
Good one 😉
You guys are unconvinceable, that couldn’t be any clearer to any observer. It is all the more amazing if it’s true that you aren’t paid to come up with all this. Could be the retiree thing, but you don’t seem old enough to fall into that demographic yet.
“You guys are unconvinceable”
You have provided NOTHING to convince anyone of anything.
You are so INEPT that you STILL can’t provide any scientific proof that enhanced atmospheric CO2 has ANY EFFECT WHATSOEVER, apart from enhanced plant growth.
EMPTY mindless yapping of fantasy AGW mantra is NOT going to convince anyone.
“but you don’t seem old enough”
And you, seb, don’t seem old enough to be out of nappies..
…explains the constant bed-wetting I guess.
“Uh, no, a single 2007 paper doesn’t answer the question. You’ve denied that both the Southern Ocean SSTs have been cooling and that the sea ice area has increased since the late 1970s. In other words, you’ve been denying the observations.”
Not the case, what I’ve been disagreeing with is that a small part of the world not warming, bucking the global trend, falsifies AGW. The climate system is a tad more complicated.
Your graph from Connolly & Soon (Ronan Connolly, Willie Soon – Arctic Ice experts? Published in a Hydrology journal?) shows a decline from over >8 million sq km down to about 5m. What it does not show is the continued decline, reaching 3.4 million in 2012. And the Alekseev paper referenced includes this phrase in the abstract:
“According to the estimates made with a simple regression model, we can expect a seasonally ice‐free Arctic Ocean as early as in the mid‐2030s.”
So, according to your sources, the decline will continue.
So, according to the ‘no signal, just an oscillation, model’ Antarctic Ice must be increasing, yes? Well actually no,over the last three years, it kinda fell off a cliff.https://nsidc.org/data/seaice_index/images/s_plot_hires.png
And according to Kostov and Marshall, this could be the beginning of the transformation from cooling to warming.
“Around the world, scientists are observing evidence of climate change — record high temperatures, rising sea levels, and melting ice sheets. But new research from MIT’s Program in Atmospheres, Oceans and Climate indicates that Antarctica and the Southern Ocean may be experiencing a period of cooling before warming takes over — and the culprit might be the ozone hole rather than greenhouse gases.
“Our study tries to address one of the most mysterious problems of recent historical climate change in the region because, in contrast to the strong global warming trend, we’ve seen persistent cooling in the Southern Ocean and sea ice expansion,” says Yavor Kostov PhD ’16, a recent MIT graduate and lead author on the study published in the journal Climate Dynamics. “And our study addresses some mechanisms that could be related to this persistent cooling trend.”
The takeaway is that we’ve identified a fundamental mechanism that allows the Southern Ocean to respond to the change in westerly winds, with initial cooling, but then we show that this might be followed by gradual warming.
http://news.mit.edu/2016/southern-ocean-cooling-in-a-warming-world-0624
I suspect though, that the readership of this website and its stench of cherries, are pretty unconvincible.
“So, according to the ‘no signal, just an oscillation, model’ Antarctic Ice must be increasing, yes? “
Phlop shows zero understanding or knowledge of the recent El Nino effect on the Antarctic sea ice. Wilful Ignorance??
No surprise, parrots just regurgitate the nonsense they are told.
Have you look at how well Antarctic sea ice is recovering this year from that El Nino, phlop
” we’ve seen persistent cooling in the Southern Ocean and sea ice expansion,” …..blah, blah….
…that this MIGHT be followed….. more blah… ”
So they ADMIT it is COOLING,
…. then CREATE a FANTASY that it MIGHT warm later.
What is SO HILARIOUS is that people like you fall for that sort of farcical nonsense. !! 🙂
Then they go on to say
“This is particularly important since over 90 percent of the world’s heat from human influences is stored in the World Ocean “
…. which is load of TOTALLY UNPROVABLE, ANTI-SCIENCE GARBAGE and is basically just ABJECT NONSENSE.
This Kostov crap is really just a load of AGW mantra driven ANTI-SCIENCE BULLS**T !!!!
No wonder you use it. !
You are very convincing at showing you are basically just a mindless parrot
But it’s not just a small part of the world that’s not been warming. The Southern Ocean cooling represents 14% of the globe….
–
Turney et al., 2017
http://www.clim-past.net/13/231/2017/cp-13-231-2017.pdf
“Occupying about 14% of the world’s surface, the Southern Ocean plays a fundamental role in ocean and atmosphere circulation, carbon cycling and Antarctic ice-sheet dynamics. … As a result of anomalies in the overlying wind, the surrounding waters are strongly influenced by variations in northward Ekman transport of cold fresh subantarctic surface water and anomalous fluxes of sensible and latent heat at the atmosphere–ocean interface. This has produced a cooling trend since 1979.”
–
This isn’t about “falsifying AGW”. It’s about falsifying the belief that there is something unusual going on with the climate…or that the modern warming is “globally synchronous”. Or that something dangerous is happening with glacier melt, sea level rise, extreme weather events, etc.
Since 1993, Greenland’s Ice Sheet Melt Has Added Just 0.39 Of A Centimeter To Global Sea Levels
Another New Paper Shows Arctic Sea Ice Has Been INCREASING Overall Since The 1930s
More Evidence Glacier Retreat Was Far More Rapid During The 1850s-1940s Than Since
2 More New Papers Affirm There Is More Arctic Ice Coverage Today Than During The 1400s
Global Sea Levels Rose A Staggering 3.1 Inches (1.42 mm/yr) During 1958-2014 … Antarctica & Greenland Combined Added 0.59 Of An Inch To Sea Levels Since 1958
Scientists Affirm: ‘No, The Arctic Is Not Melting’ … ‘Nothing Has Changed Since 1900’
Scientists Affirm ‘Recent Lack Of Any Detectable Acceleration’ In Sea Level Rise
12 New Papers: North Atlantic, Pacific, And Southern Oceans Are Cooling As Glaciers Thicken, Gain Mass
Recent CO2 Climate Sensitivity Estimates Continue Trending Towards Zero
20 New Papers Crush Claims Of A Man-Made Link To Arctic Climate Change, Glacier Retreat, Sea Ice Change
Groundbreaking AGW-Undermining Study: Greenland’s Warming, Ice Loss Due To Geothermal Heat
Past Sea Levels Rose 4-6 Meters Per Century, Shorelines Retreated 40 Meters Per Year…Without CO2 Flux
10,000 To 5,000 Years Ago, Global Sea Levels Were 3 Meters Higher, Temperatures 4-6° C Warmer
485 Scientific Papers Published In 2017 Support A Skeptical Position On Climate Alarm
Attribution Shift: Scientists Increasingly Link Climate Change To Solar Forcing In Scientific Journals
7 New (2017) Papers Forecast Global Cooling, Another Little Ice Age Will Begin Soon
35 New Papers Affirm Warmth, Elevated CO2 Are Good For The Earth And Its Inhabitants
Swiss Physicist Concludes IPCC Assumptions ‘Violate Reality’…CO2 A ‘Very Weak Greenhouse Gas’
The following is just an abbreviated short list. There are hundreds more like these.
Since 1870s – no warming
Greenland – no warming
New Zealand – no warming
Antarctica – no warming
North Atlantic – no warming
Western Pacific – no warming
India/Western Himalaya – no warming
Pakistan – no warming
Turkey – no warming
Himalayas/Nepal – no warming
Siberia – no warming
Portugal – no warming
NE China – no warming
SW China – no warming
South China – no warming
West China – no warming
Southern South America – no warming
Canada (B.C.) – no warming
Canada Central – no warming
Since 1940s/50s – no warming
Northern Hemisphere – no warming
Arctic Region – no warming
Greenland – no warming
South Iceland – no warming
North Iceland – no warming
Alaska – no warming
New York – no warming
Rural U.S. – no warming
Northern Europe – no warming
Western Europe – no warming
Mediterranean Region – no warming
Finland and Sweden – no warming
East Antarctica – no warming
North Atlantic – no warming
Western North Atlantic – no warming
Brazil – no warming
SE Australia – no warming
Southern South America – no warming
Andes Mountains – no warming
Chile – no warming
MANY places in the world, (and periods) are NOT warming
Japan since 1998
https://s19.postimg.org/s9bwikr0z/Japan_post_1998.png
Whole world between 1980 and 1998
https://s19.postimg.org/iwoqwlg1f/UAH_before_El_nino.png
Whole World 2001-2015
https://s19.postimg.org/b9yx58cxf/UAH_after_El_nino.png
UAH South Extratropics
https://s19.postimg.org/4khzxrbzn/UAH_So_Extropical.png
Canada
https://s19.postimg.org/o1ou9ruir/canada_cooling.jpg
Central Africa
https://s19.postimg.org/uzqef4bn7/central_Africa.png
Australia last 20 years
https://s19.postimg.org/t849zahv7/Australia_20_years.png
China
https://s19.postimg.org/hfpui8gyr/China_long_term_temp.png
These are just a few. A couple of months ago there was a very long posted here, I’m sure K has most of them.
NOAA Equatorial sea temperature.
https://s19.postimg.org/u9nwbyrxv/NOAA-_CPC-_Equatorial_Average_Sea_Temp_Upper300m.gif
“Whole world between 1980 and 1998
https://s19.postimg.org/iwoqwlg1f/UAH_before_El_nino.png
Whole World 2001-2015
https://s19.postimg.org/b9yx58cxf/UAH_after_El_nino.png”
LOL. Whole world 1980-present up nearly 0.5C
http://www.woodfortrees.org/plot/uah6/from:1980/plot/uah6/from:1980/trend
Still getting your 5 a day, I see.
Poor phlop, faceplants BIG TIME.
Fell straight into the trap set for him… DUMB !!!
You see, you have accepted that the two ZERO-WARMING period, 33 years out of 39, are correct.. well done 🙂
Then, you HAVE to use the El Ninos to create a warming trend, PROVING my point that the ONLY warming has come from oceans, and is therefore NOT related to human CO2 or human ANYTHING.
There is ABSOLUTELY ZERO CO2 signature in the whole of the satellite record. Thanks for highlighting that FACT. 🙂
You have shown us, and yourself, that the slight warming has been TOTALLY NATURAL
Another tiny step forward for a mindless AGW sympathiser. 🙂
Or are you a DENIER of NATURAL CLIMATE CHANGE ????
Here are your carefully cherry-picked ‘no warming’ periods.
http://www.woodfortrees.org/plot/uah6/from:1980/plot/uah6-land/from:1980/to:1998/trend/plot/uah6/from:2001/to:2015/trend
1. You’ll notice the second is around 0.4C warmer than the first. ENSO is an OSCILLATION.
2. If you remove the 1998 and 2016 El Ninos you should also remove the 2010/11 La Nina. Otherwise you are cherry-picking.
3. El Nino years, La Nina years and ENSO neutral years all have the same trend.
http://skepticalscience.com//pics/AllTrends.png
Using SKS makes you look like a rabid alarmist with zero thought process of your own.
If you think ENSO is a regular type oscillation.. you display your IGNORANCE, yet again. It is a charge-discharge system.
The 2010/2011 La Nina/El Nino pairing had zero effect on the trend.
SkS is NOT using real data they are using specifically fabricated data, that bears very little resemblance to reality.
What a monumental FRAUD they are.
And on your WFT graph you show how mathematically inept you are. You probably don’t even realise that the calculated trend in the first section comes from when the oscillations start and finish. So DUMB !!!
Mindless “monkey-with-a-ruler” in the use of linear trends on oscillations is for the not well educated.. like you.
But I’ll even attempt to educate you… (not much chance of you learning though)
What is the calculated linear trend of this graph?
https://s19.postimg.org/nnx72yttf/sine_simple.png
Ya beat me to it, K 🙂
Science by jpeg. I am sure you find it convincing. I downloaded the data behind the ‘no warming in Greenland’ graph. The average for the 30 year period at the end was nearly 2C higher than the 30 years at the start.
I tracked down the graph you say demonstrates no warming in the Western Pacific. Turns out to be a study in oceanic pH, and the graph is of SSTs ON ONE ISLAND. The data were derived from ‘statistical methods’ prior to 1950 and the Reynolds SST dataset after that. The Reynolds dataset globally shows clear warming. Taking one (minute) part of a dataset that supports your point, ignoring the global picture. Classic cherrypick. Yes I am sure you do have hundreds more jpegs like this one, and I am sure you find them equally convincing.
Here’s just one
https://www.metoffice.gov.uk/hadobs/hadcrut4/data/current/web_figures/hadcrut4_annual_global.png
Yes, Phil. That’s because all the net warming took place between the late 19th century and 1940. Since then, it cooled and then warmed up to about the same levels as the 1920s to 1940s, as shown here. The first half of the 20th century average was actually higher than the last few decades.
Box et al., 2009
“The annual whole ice sheet 1919–32 warming trend is 33% greater in magnitude than the 1994–2007 warming. … The 1955–82 cooling phase was most significant during autumn in east and southern Greenland.”
3 New Papers: Greenland 3-5°C Warmer With 40 Kilometers Less Ice Area 4,000-10,000 Years Ago
———————————-
Greenland has been cooling since the early 2000s.
Greenland cooling since 2005
Kobashi et al., 2017
https://www.nature.com/articles/s41598-017-01451-7
“For the most recent 10 years (2005 to 2015), apart from the anomalously warm year of 2010, mean annual temperatures at the Summit exhibit a slightly decreasing trend in accordance with northern North Atlantic-wide cooling. The Summit temperatures are well correlated with southwest coastal records (Ilulissat, Kangerlussuaq, Nuuk, and Qaqortoq).”
—
Greenland Cooling since 2001
Westergaard-Nielsen et al., 2018
https://www.nature.com/articles/s41598-018-19992-w
“The most recent and detailed trends based on MODIS (2001–2015) shows contrasting trends across Greenland, and if any general trend it is mostly a cooling. The MODIS dataset provides a unique detailed picture of spatiotemporally distributed changes during the last 15 years. … Figure 3 shows that on an annual basis, less than 36% of the ice-free Greenland has experienced a significant trend and, if any, a cooling is observed during the last 15 years (<0.15 °C change per year).”
“Central Canada – No warming”
Based on Viau and Gajewski, which has this concluding paragraph.
“Our results show that at no time during the Holocene have millennial-scale temperature variations exceeded 10.78C in boreal Canada (Table 1). These results therefore show that presently observed temperature increases in northern Canada far exceed natural variability found in this study (Solomon et al. 2007), providing paleoclimatic support for human cause of the presentday global warming.”
“New Zealand – No warming”
Based on Turney et al http://nora.nerc.ac.uk/id/eprint/515555/1/Turney.pdf
Check out Figure 9e
Antarctica – No warming
Based on Schneider et al 2006 https://agupubs.onlinelibrary.wiley.com/doi/full/10.1029/2006GL027057
You show the proxy reconstruction, but not the instrumental record – Figure 3C – which shows strong warming.
North Atlantic – No warming.
Actually just the Irminger Sea, caused by localised ocean/atmosphere interaction, discussed here
https://fmkdejong.wordpress.com/2016/06/29/a-blob-post-from-the-irminger-sea/
Pakistan – No warming
Based on Zafar et al
“A systematic increase in global temperature
since the industrial revolution has been attributed to anthropogenic
forcing. This increase has been especially evident
over the Himalayas and Central Asia and is touted as a
major contributing factor for glacier mass balance declines
across much of this region. However, glaciers of Pakistan’s
Karakorum region have shown no such decline during
this time period, and in some instances have exhibited
slight advance. This discrepancy, known as the ‘Karakorum
Anomaly’, has been attributed to unusual amounts of debris
covering the region’s glaciers; the unique seasonality of
the region’s precipitation; and localized cooling resulting
from increased cloudiness from monsoonal moisture.”
The conclusion notes that
” the increasing mass balance is the exception and not the norm, and is limited to a small region of the Karakorum where all of our sites are located. ”
Another cherry-pick. Yawn.
Pakistan, Kose et al
“We highlight that the 20th century warming trend is unprecedented
within the context of the past ca. 200 years”
Enough!
Gajewski: no warming in Arctic Canada in the last 150 years – with temperatures 3°C warmer ~5,000 to 7,000 years ago.
Fortin and Gajewski, 2016
http://www.sciencedirect.com/science/article/pii/S003358941600017X
“Although biological production increased in the last 150 yr, the reconstructed temperatures do not indicate a warming during this time. … Modern inferred temperatures based on both pollen and chironomids are up to 3°C cooler than those inferred for the mid-Holocene.”
———————————
Turney et al., 2017: Cooling since the 1980s:
MacQuarie Island (New Zealand) cooling
Campbell Island (New Zealand) cooling
——————————–
New Zealand instrumental record since 1910 shows no obvious warming: de Fritas et al., 2015
———————————-
New Zealand just as warm or warmer during the Medieval Warm Period
Cook et al., 2002
http://onlinelibrary.wiley.com/doi/10.1029/2001GL014580/full
“This record is the longest yet produced for New Zealand and shows clear evidence for persistent above-average temperatures within the interval commonly assigned to the MWP [Medieval Warm Period]. Comparisons with selected temperature proxies from the Northern and Southern Hemispheres confirm that the MWP was highly variable in time and space. Regardless, the New Zealand temperature reconstruction supports the global occurrence of the MWP.”
—————————————-
Abbot and Marohasy, 2017
http://www.sciencedirect.com/science/article/pii/S2214242817300426
“The proxy measurements suggest New Zealand’s climate has fluctuated within a band of approximately 2°C since at least 900 AD, as shown in Figure 2. The warming of nearly 1°C since 1940 falls within this band. The discrepancy between the orange and blue lines in recent decades as shown in Figure 3, suggests that the anthropogenic contribution to this warming [1°C since 1940] could be in the order of approximately 0.2°C. [80% of the warming since 1940 may be due natural factors]. … [T]he increase in temperature over the last 100 years can be largely attributed to natural phenomena.”
—————————————
New Zealand sea levels were about 3 meters higher than now 6,000 to 7,000 years ago
Clement et al., 2016
http://www.sciencedirect.com/science/article/pii/S0277379115301232
“In North Island locations the early-Holocene sea-level highstand was quite pronounced, with RSL [relative sea level] up to 2.75 m higher than present. In the South Island the onset of highstand conditions was later, with the first attainment of PMSL being between 7000–6400 cal yr BP. In the mid-Holocene the northern North Island experienced the largest sea-level highstand, with RSL up to 3.00 m higher than present.”
Sea levels along New Zealand’s coast has rapidly decelerated since the first half of the 20th century
Gehrels et al., 2012
http://pure.qub.ac.uk/portal/files/1844373/Gehrels_etal_2012_EPSL.pdf
“Between 1900 and 1950 relative sea level rose at an average rate of 4.2 ±0.1 mm/yr. During the latter half of the 20th century the reconstructed rate of relative sea-level rise was 0.7 ±0.6 mm/yr. Our study is consistent with a similar pattern of relative sea-level change recently reconstructed for southern New Zealand.”
https://climatefeedback.org/claimreview/incorrect-claim-global-warming-mostly-natural-based-on-study-that-cant-support-conclusion-jennifer-marohasy-john-abbot/
roflmao.
Pholp yet again links to the very empty heart of the AGW scam.
Then uses the Pages2K fabrication that phlop himself said was wrong.
You are finding it quite tough to keep your LIES and misinformation coherent, aren’t you phlop. 😉
Stop the moronic copy-paste and try thinking for yourself for a change…. if you are capable of that.
Dump the manic brain-hosing first, though.
Would that be the Abbot and Marohasy paper where they messed up the data handling, so 1965AD became 2000AD, – missing out the majority of recent warming?
The paper described by Dr Gavin Schmidt of NASA as ‘worthless’ because ‘conceptually this methodology can’t possibly work’
Of which Dr Benjamin Henley said ‘The paper is seriously flawed and should be retracted by the journal’
(The journal has folded BTW)
The paper of which Prof Piers Forster, (director of the Priestley international centre for climate at the University of Leeds) said “the methodology is unphysical” because the authors had assumed most of the 1C warming that the planet had seen was caused by random variation, “but we know this is not the case.” He said the paper’s conclusion the ECS was only 0.6C could be ruled out entirely.
The paper Prof Steven Sherwood, deputy director at the University of New South Wales climate change research centre said ““The analysis by the authors seems to work like magic. “What is interesting about this fancy curve-fitting exercise is that the authors are doing exactly what mainstream climate scientists have falsely been accused of doing: extrapolating into the future from short past records.
“There is much evidence that recent warming is unprecedented, for example ancient ice in various mountain regions such as Peru that is now melting for the first time in millennia. Thus the authors’ conclusion is contradicted by direct physical evidence. Also, the authors are alleging that the climate can exert large natural swings in temperature but is insensitive to heating. This is a contradiction.”
Would that be the John Abbott who falsely claimed an affiliation with James Cook University?
That paper?
But what would this blog be without the junk science and the cherry-picks?
https://www.theguardian.com/environment/planet-oz/2017/aug/26/institute-of-public-affairs-paper-claim-global-warming-natural-junk-science
Philip, the Moberg 2005 reconstruction (referenced by Marohasy and Abbott by reusing the wrongly-scaled NH graph as shown in Geirsdottir et al., 2009) runs through 1979, not 1965. It (of course) adds artificially-warmed-up instrumental temperatures for the 1979-2000 slope because the proxy data showed a decline in temperatures after the 1980s…which is why the dataset overseers had to “hide” that decline by adding “completely artificial adjustments”.
Here’s what that divergence (between instrumental data and the proxy data that was perfectly fine up until the 1960s, then discarded because it didn’t show warming) looked like:
Northern Hemisphere (Briffa, 2002)
Or here: Mike’s Nature Trick to Hide the Decline
Here‘s what Dr. Marohasy writes about the trick to hide the decline in temperatures that are hidden by grafting instrumental figures onto proxy records. Everyone knows it’s not scientific to mix and match different data sources…but that’s the only way your side can get alarming warming outside the range of natural variability. If they continued to use proxy evidence after 1979, the alarming warming disappears.
For example, here are Northern Hemisphere reconstructions that don’t graft on artificially-warmed-up instrumental records onto the end of proxy records. They show no net warming after the 1930s and 1940s, with the rise between 1980 and 2000 similar to or less than the early twentieth century warming peak.
Christiansen and Ljungqvist, 2012 (91 NH proxies)
Xing et al., 2016 (126 NH proxies)
Schnieder et al., 2015 (15 NH proxies)
Stoffel et al., 2015 (22 NH proxies)
This same pattern of a warmer-than-now 1920s-1940s period can be seen in the instrumental data when removing the records compromised by ocean-air effects:
Lansner and Pepke Pederson, 2018 (433 thermometer stations from across the world)
Here are 75 scientific papers that also identify very low climate sensitivity for CO2 doubling.
Here are a few of the hundreds of papers that identify modern climate changes as not falling out of the range of natural variability.
Haine, 2016
“The anthropogenic melt from the Greenland ice sheet is still too small to be detected. … [N]o clear change in the delivery of Arctic freshwater to the North Atlantic due to human climate forcing.”
Hansen et al., 2016
“[W]e found that there is (yet) no observable sea-level effect of anthropogenic global warming in the world’s best recorded region.”
Ding et al., 2014
http://www.nature.com/nature/journal/v509/n7499/full/nature13260.html
“Here we show that the recent warming in this region [northeastern Canada and Greenland] is strongly associated with a negative trend in the North Atlantic Oscillation, which is a response to anomalous Rossby wave-train activity [planetary waves related to the Earth’s rotation] originating in the tropical Pacific. … This suggests that a substantial portion of recent warming in the northeastern Canada and Greenland sector of the Arctic arises from unforced natural variability.”
Parker and Ollier, 2017
“The loud divergence between sea-level reality and climate change theory—the climate models predict an accelerated sea-level rise driven by the anthropogenic CO2 emission—has been also evidenced in other works such as Boretti (2012a, b), Boretti and Watson (2012), Douglas (1992), Douglas and Peltier (2002), Fasullo et al. (2016), Jevrejeva et al. (2006), Holgate (2007), Houston and Dean (2011), Mörner 2010a, b, 2016), Mörner and Parker (2013), Scafetta (2014), Wenzel and Schröter (2010) and Wunsch et al. (2007) reporting on the recent lack of any detectable acceleration in the rate of sea-level rise.”
—
Jones et al., 2016
http://www.nature.com/nclimate/journal/v6/n10/full/nclimate3103.html
“Most observed trends [over the 36-year satellite data] are not unusual when compared with Antarctic palaeoclimate records of the past two centuries. … [C]limate model simulations that include anthropogenic forcing are not compatible with the observed trends. This suggests that natural variability overwhelms the forced response in the observations”
—
Stenni et al., 2017
http://www.clim-past-discuss.net/cp-2017-40/cp-2017-40.pdf
“No continent-scale warming of Antarctic temperature is evident in the last century. … [M]ost of the trends observed since satellite climate monitoring began in 1979 CE cannot yet be distinguished from natural (unforced) climate variability, and are of the opposite sign [cooling] to those produced by most forced climate model simulations over the same post-1979 CE interval.”
Straight to the ad-hom when you know you have ZERO-SCIENCE to counter anything said.
Typical of the scum-like AGW sympathiser.
John Abbot held an adjunct position at James Cook.. he therefore had an affiliation with that university, even if his contract had expired.
You are again just acting as a ZERO thought parrot, regurgitating rubbish, because it all you have.
Sherwood has been proven wrong many times,
Schmidt is one of the instigators of temperature data corruption.
As for the dope from Leeds Uni
““the methodology is unphysical” because the authors had assumed most of the 1C warming that the planet had seen was caused by random variation, “but we know this is not the case.””
What a moronic statement.
They know its cyclical, with a lot of random variability.
Zero proof its anything to do with human CO2.
“where they messed up the data handling”
You mean like the PAGES2K fraudsters did when they started the up-tick in 1920 ???
And like Mann did when he turned data upside down and erased other data to hide the decline?
It should also be noted that NOT ONE of those AGW collaborators would have a job if it weren’t for their manic swilling off the climate change trough, they would loose their pseudo-status if they ever said a word against the AGW mantra.
Brought and paid for. !!!.
Which trough do YOU swill from, Phlop?
John Abbot has a BSc in chemistry from Imperial College, London, an MSc from the University of British Columbia, Canada, a Master of Biotechnology from the University of Queensland and a PhD in chemistry from McGill University, Canada.
During the period 2009 – 2015 Dr Abbot had an appointment at Central Queensland University as a Professorial Research fellow
He was also an adjunct professor at both James Cook and UTas.
So yes, he has academic affiliations to James Cook University regardless of if his professorship is current or not, and from the comments of Physicist, and former Dean of Science at James Cook University, Dr Nicol, that affiliation was strongly kept. .
Caught in another FAILED ad-hom, yet again, Phlop (how did the breed a parrot to a weasel to make you?)
The instrumental record shows no warming either.
Antarctica-wide temperatures, 1979-2016
The Antarctica Peninsula has been rapidly cooling since 1999.
East Antarctica has been rapidly cooling since 1979 according to instrumental records too.
“Ubiquitous cooling” across East Antarctica since 1979
Clem et al., 2018
“This study finds recent (post-1979) surface cooling of East Antarctica during austral autumn to also be tied to tropical forcing, namely, an increase in La Niña events. … The South Atlantic anticyclone is associated with cold air advection, weakened northerlies, and increased sea ice concentrations across the western East Antarctic coast, which has increased the rate of cooling at Novolazarevskaya and Syowa stations after 1979. This enhanced cooling over western East Antarctica is tied more broadly to a zonally asymmetric temperature trend pattern across East Antarctica during autumn that is consistent with a tropically forced Rossby wave rather than a SAM pattern; the positive SAM pattern is associated with ubiquitous cooling across East Antarctica.”
———————————————–
No, the cooling cuts across the North Atlantic, not just the Irminger Sea.
North Atlantic Ocean Cooling (12 papers):
1. Kim et al., 2017
2. Rosenthal et al., 2017
3. Mark, 2016
4. Bird et al., 2011
5. Nicolle et al., 2018
6. Chafik et al., 2016
7. Piecuch et al., 2017
“In 2004–2005, SPNA decadal upper ocean and sea-surface temperature trends reversed from warming during 1994–2004 to cooling over 2005–2015.”
8. Robson et al., 2017
“The cooling of the SPG [Subpolar Gyre, North Atlantic] after 2005 is dominated by a reduction in ocean heat transport convergence”
9. Duchez et al., 2016
10. Serykh et al., 2016
11. Yashayaev and Loder-2017 (Central Labrador Sea)
12. Robson et al., 2016
“[S]ince 2005 a large volume of the upper North Atlantic Ocean has cooled significantly by approximately 0.45 °C or 1.5 × 10²² J, reversing the previous warming trend. … The observed upper ocean cooling since 2005 is not consistent with the hypothesis that anthropogenic aerosols directly drive Atlantic temperatures.”
—————————
No warming for the Pakistan/NW India/Himalayan/Central Asia region (12 more papers)
1. Lan et al., 2017
2. Sunkara and Tiwari, 2016
3. Lansner and Pepke Pederson, 2018
4. Chand et al., 2017
5. Thapa et al., 2015
“[T]emperature in Central Asia and northern Hemisphere revert back towards cooling trends in the late twentieth century. Thus looking at all the records we observed that our present study is following patterns of temperature variations observed in surrounding regions.”
6. Yadav, 2009
“The decreasing temperature trend in late 20th century is consistent with trends noted in Nepal (Cook et al. 2003), Tibet (Briffa et al. 2001) and Central Asia (Briffa et al. 2001). The cooling trend in late 20th century mean temperature has been found to be due to cooling trend noted in minimum temperature during the second half of the 20th century in semi-arid western Himalaya.”
7. Yadav et al., 1997
“The most striking feature of the present reconstruction is the absence of any warming trend in the 20th century”
8. Bhattacharyya and Chaudhary, 2003
9. Sano et al., 2005
“March–September temperature was reconstructed for the past 249 years, which shows a warming trend from 1750s until approximately 1790, followed by cooling until 1810, then by a gradual warming trend extending to 1950, and a notable cold period continuing up to the present. No evidence of a consistent warming trend over the last century or two commonly appearing in higher latitudes was found in the present reconstruction”
10. Li et al., 2011
11. Fan et al., 2009
12. Yadav and Singh, 2002
“The 1945–1974 period was the warmest 30-yr mean period of the 20th century. However, this warming, in the context of the past four centuries, appears well within the range of normal limits. The 30-yr mean temperature anomaly for 1662–1691 (0.19°C) exceeds in magnitude the 1945–1974 mean (0.05°C).”
———————————–
Keep trying, Philip. It’s really working.
Please could you provide links to the actual papers?
Not just graphs you have removed from the papers and uploaded.
Let us deconstruct a typical ‘Notrickszone’ claim.
https://notrickszone.com/wp-content/uploads/2017/04/Holocene-Cooling-Pacific-Western-SSTs-Wei-15.jpg
This is said to show ‘no warming in the Western Pacific’. But naturally no link to the paper itself is posted, just yet another jpeg.
The paper is ‘Decadal variability in seawater pH in the West Pacific: Evidence from coral δ 11 B records’
Focussed on oceanic pH (the paper acknowledges the impact on oceanic pH of manmade greenhouse gases btw) it includes a graph of sea surface temperatures (SST) from the study site, a single eastern Hainan Island, a microclimate influenced by the
Qiongdong upwelling system
According to the paper, the SSTs were derived from the Reynolds SST dataset. This dataset shows that globally, sea surface temperatures have unequivocally been rising at around 0.16C/decade in recent decades.
So, it is a cherry-pick. Selective data from a single island when considering the whole dataset reveals unequivocal global warming.
Given this level of dishonesty and desperation, one can only conclude that ‘NoTricksZone’ is named ironically.
Goodbye!
Correct. Here are 13 other papers that also show no warming in the Western Pacific.
1. Yamamoto et al., 2016
2. Zhang et al., 2017
3. Dechnik et al., 2017
4. Rosenthal et al., 2017
5. Cheung et al., 2017 (East Pacific)
6. Bird et al., 2017
7. Dodrill et al., 2017
“SST during the 1500-1100 cal BP time period … warmer than those today by approximately 1-2°C“
8. Kawahata et al., 2017
9. Sun et al., 2017
10. Rosenthal et al., 2017
11. Kawakubo et al., 2017
12. Shevenell et al., 2017
13. Li, 2017
“In the Southern Ocean, the increasing trend of the total OHC slowed down and started to decrease from 1980, and it started to increase again after 1995. In the warming context over the whole period [1970-2009], the Pacific was losing heat, especially in the deep water below 1000 m and in the upper layer above 300 m, excluding the surface 20 m layer in which the OHC kept increasing through the time.”
There are many other papers to choose from (besides the 13 above) that show no warming in the Western Pacific.
It would appear that at least the desperation has been coming from you, Philip. We are calmly presenting the science here.
You made a valiant effort trying to keep up. Most people like you give up much earlier and just start in with the name-calling.
Phlop can’t cope with graphs.
He needs to be able to find the unsubstantiated phrases supporting the AGW mantra, that were inserted to get through AGW gatekeeping.
DATA is unimportant to him.
Argo and Ceres
https://s19.postimg.org/o30eavuv7/change-in-ohc-argo-and-ceres.png
“” the increasing mass balance is the exception and not the norm, and is limited to a small region of the Karakorum where all of our sites are located. ””
No data.. just supposition….. a throw-away line to get passed the AGW gatekeepers.
You really aren’t a very convincing AGW aco-lite. !
Basically just a phlop. !
“Another cherry-pick”
Yep, the WHOLE orchard. !
No wonder Phlop’s comments are so EMPTY.
@Philip Clarke
More appeals to authority is all you have. All your cited reference believe that so-and-so’ is happening, or will happen (e.g. Kostov and Marshall, and Connolly & Soon’s predictions)
No figures, no measurement equals NO SCIENCE!
Predictions are just that, something that may, or may not happen. Soothsayers are NOT scientists.
“Here are 13 other papers that also show no warming in the Western Pacific.”
No. Here are 13 graphs carefully removed from the papers, making it hard to check.
Just like you did with Viau and Gajewski, which clearly states.
“Our results show that at no time during the Holocene have millennial-scale temperature variations exceeded 10.78C in boreal Canada (Table 1). These results therefore show that presently observed temperature increases in northern Canada far exceed natural variability found in this study (Solomon et al. 2007), providing paleoclimatic support for human cause of the presentday global warming.”
The exact opposite of what you claim. Now that we have established the honesty level around here, a thousand more such graphs would be unpersuasive.
Let us take just one more example, Kim et al that shows ‘no warming’ in the North Atlantic. No link to the paper, which I’ve been unable to locate, but the dataset is given as HADSST. Here it is
http://www.woodfortrees.org/plot/hadsst3gl/from:1940/mean:12/plot/hadsst3gl/from:1975/trend
If we consider ALL the data, a clear and rapid warming trend. A thousand cherry-picked graphs will not change that.
Show us where SST’s were measure before 2003, Phlop.
https://s19.postimg.org/46xcg7377/figure-42.png
Even Phil Jones at CRU said the southern hemisphere was “mostly made up” (What percentage of the worlds oceans is that, Phlop?) OOPS !!
…. and the NH was only covered by very select zones of shipping lanes.
How much is real and totally natural RECOVERY from the COLDEST period in 10,000 years.
and how much is just PURE FABRICATION. !!!
Funny how satellite measurements of the ocean between El Ninos..
show NO-WARMING from 1980-1997
https://s19.postimg.org/uwt8kfcg3/UAH_oceans_1980-1997.png
and NO WARMING from 2001-2015
https://s19.postimg.org/msl4fznjn/UAH_oceans_2001-2015.png
Funny also that satellite measurements show the peak of the 1998 El Nino ABOVE the peak of the 2015 El Nino.
Something is pretty wonky with HadSST… that is FOR SURE !!!
Here is the ARGO and Ceres data.
https://s19.postimg.org/o30eavuv7/change-in-ohc-argo-and-ceres.png
hmmm.
It really makes the HadSST3 FABRICATION look quite farcical, doesn’t it. 🙂
[…] https://notrickszone.com/2018/03/30/snow-cover-ice-volume-growth-show-global-climate-is-a-lot-more-th… […]
It’s getting really really old having the trolls regurgitate the nonsense that temperature ANOMALIES are important (NOTE – most of what they call “temperatures” are in fact temperature “anoma_LIES.”
Here, yet again, is why using residuals proves nothing, except the desperation of those pushing that nonsense.
https://www.youtube.com/watch?v=kwIixU1JyDU
They are obsessing over nothing. Stop being distracted by and worrying about it!
See also here.
https://science.house.gov/sites/republicans.science.house.gov/files/documents/111710_Lindzen.pdf
Remember! When they say “temperatures,” look at the scale, and it will usually say “anomalies.” They are NOT the same thing. Don’t let them con you into thinking that it is.
PS – See pp 11-13 of second link for relevant graphics.